


Simulation analysis results
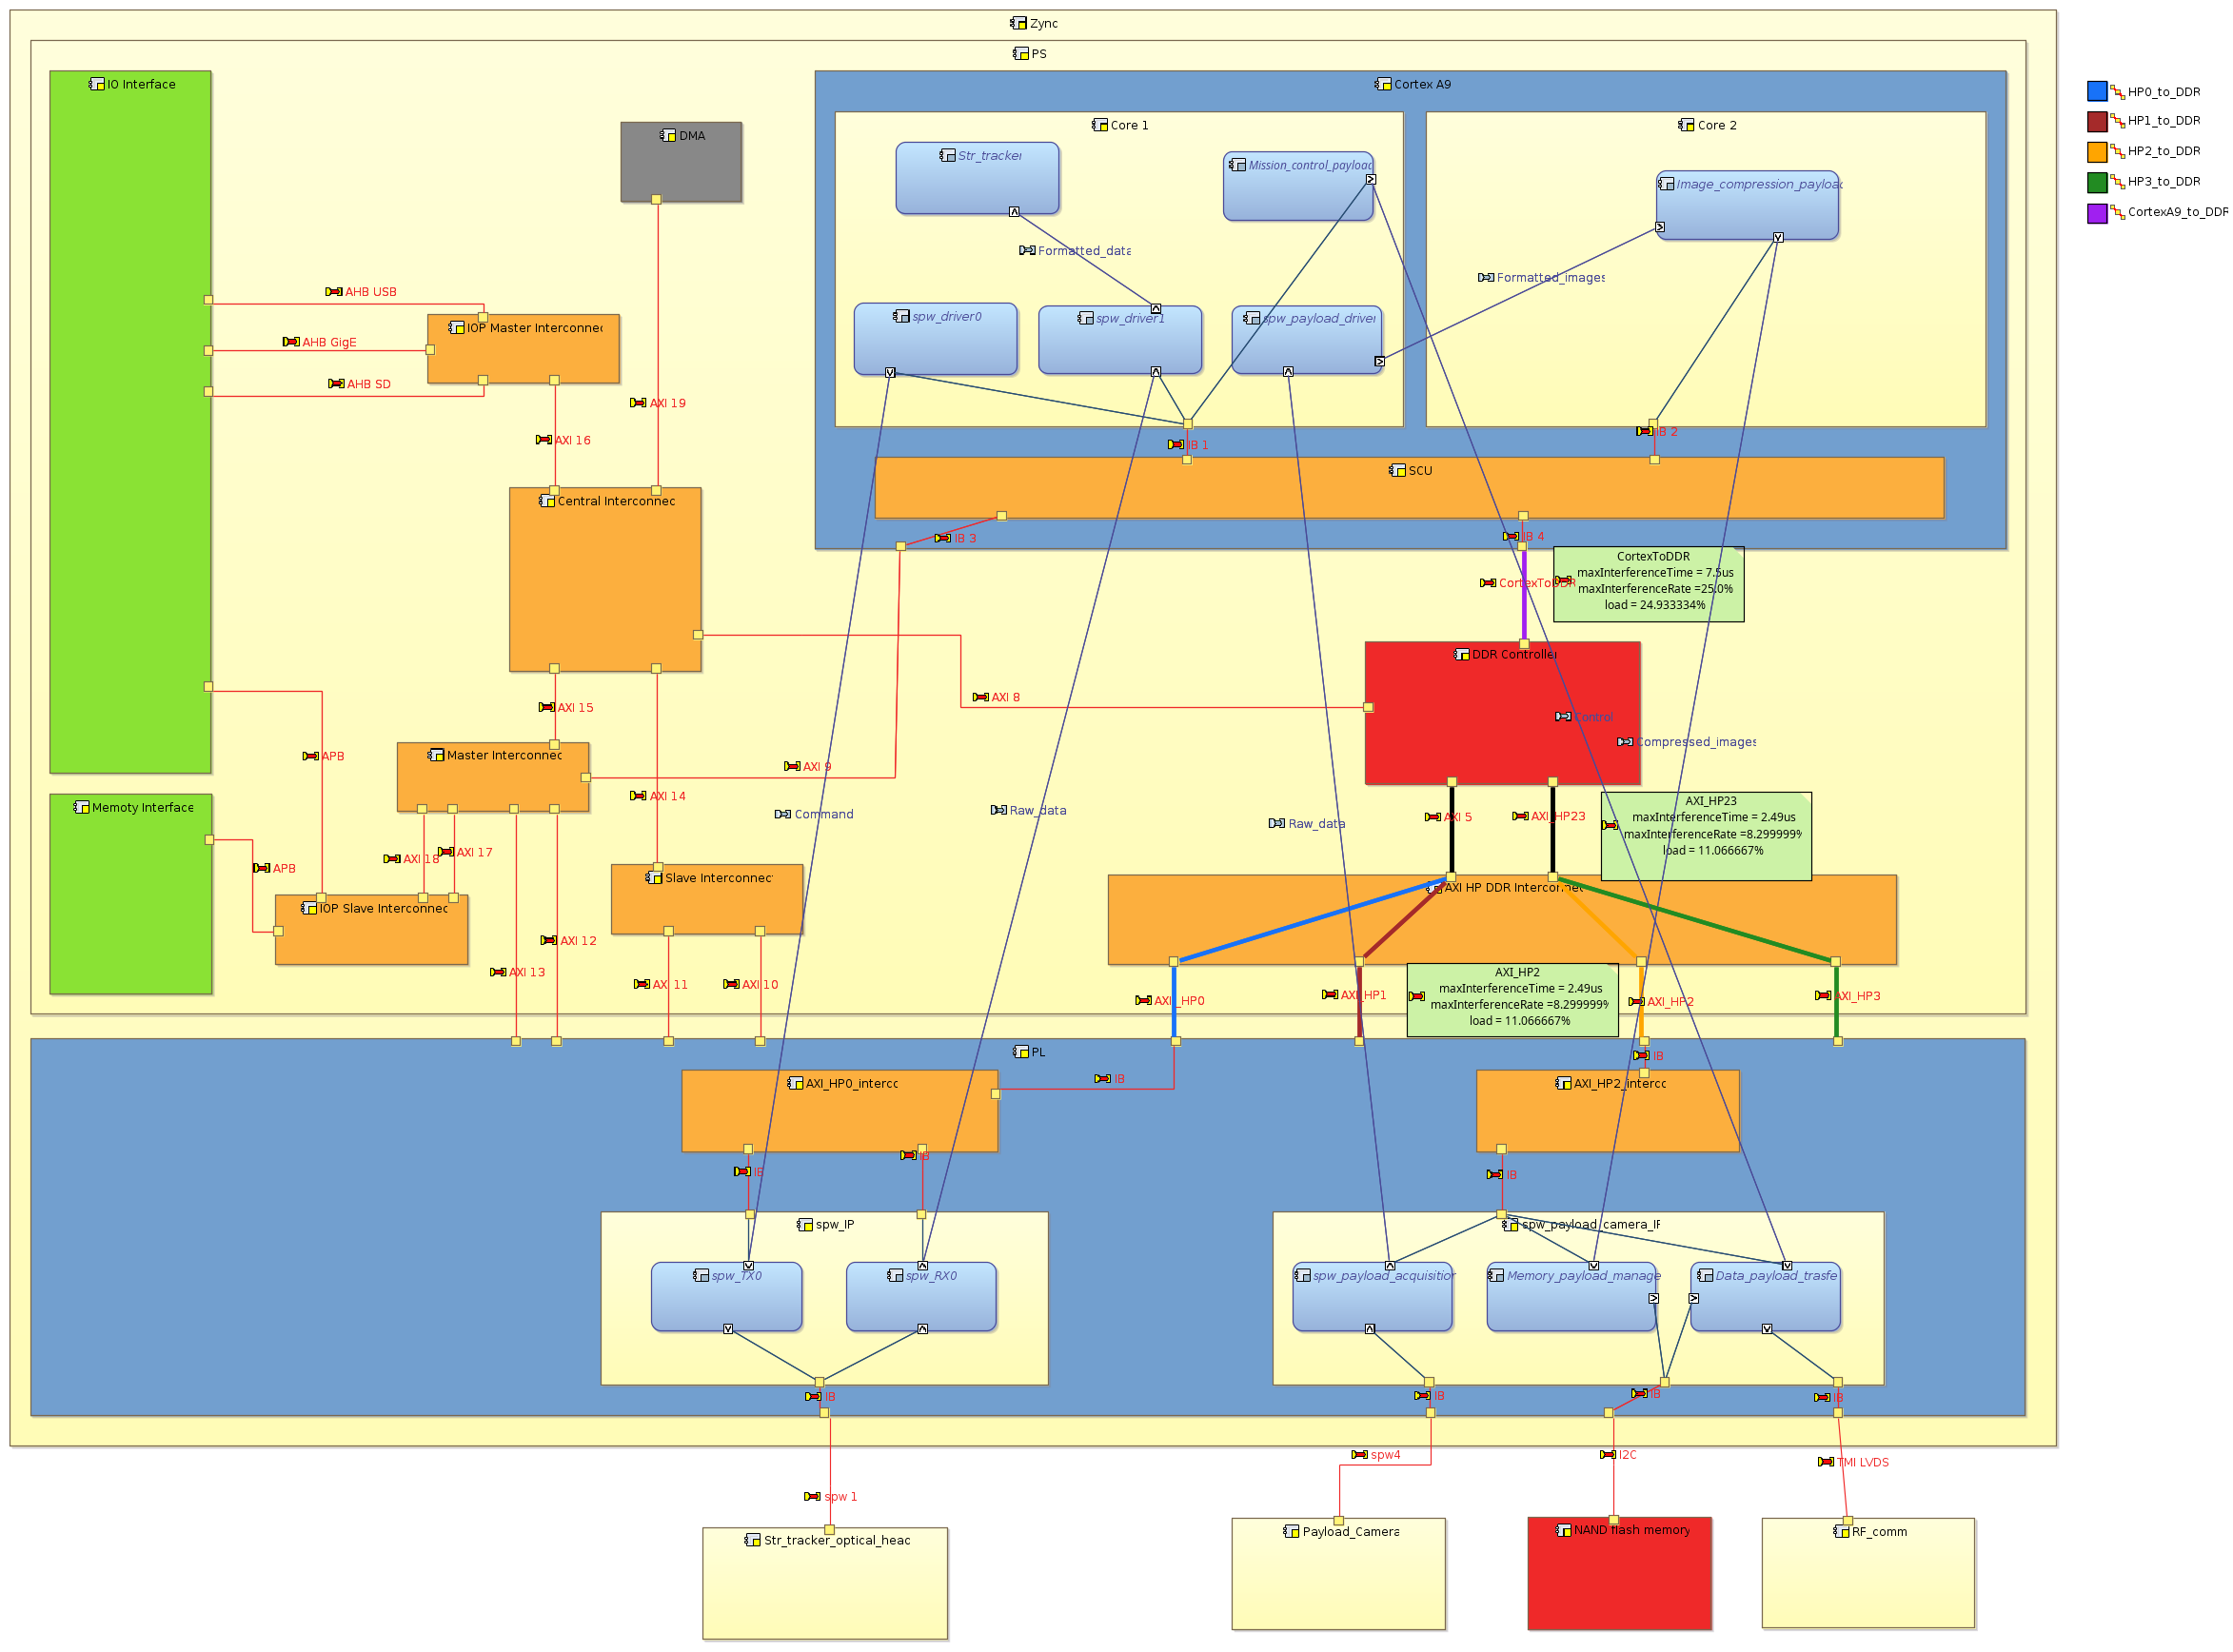
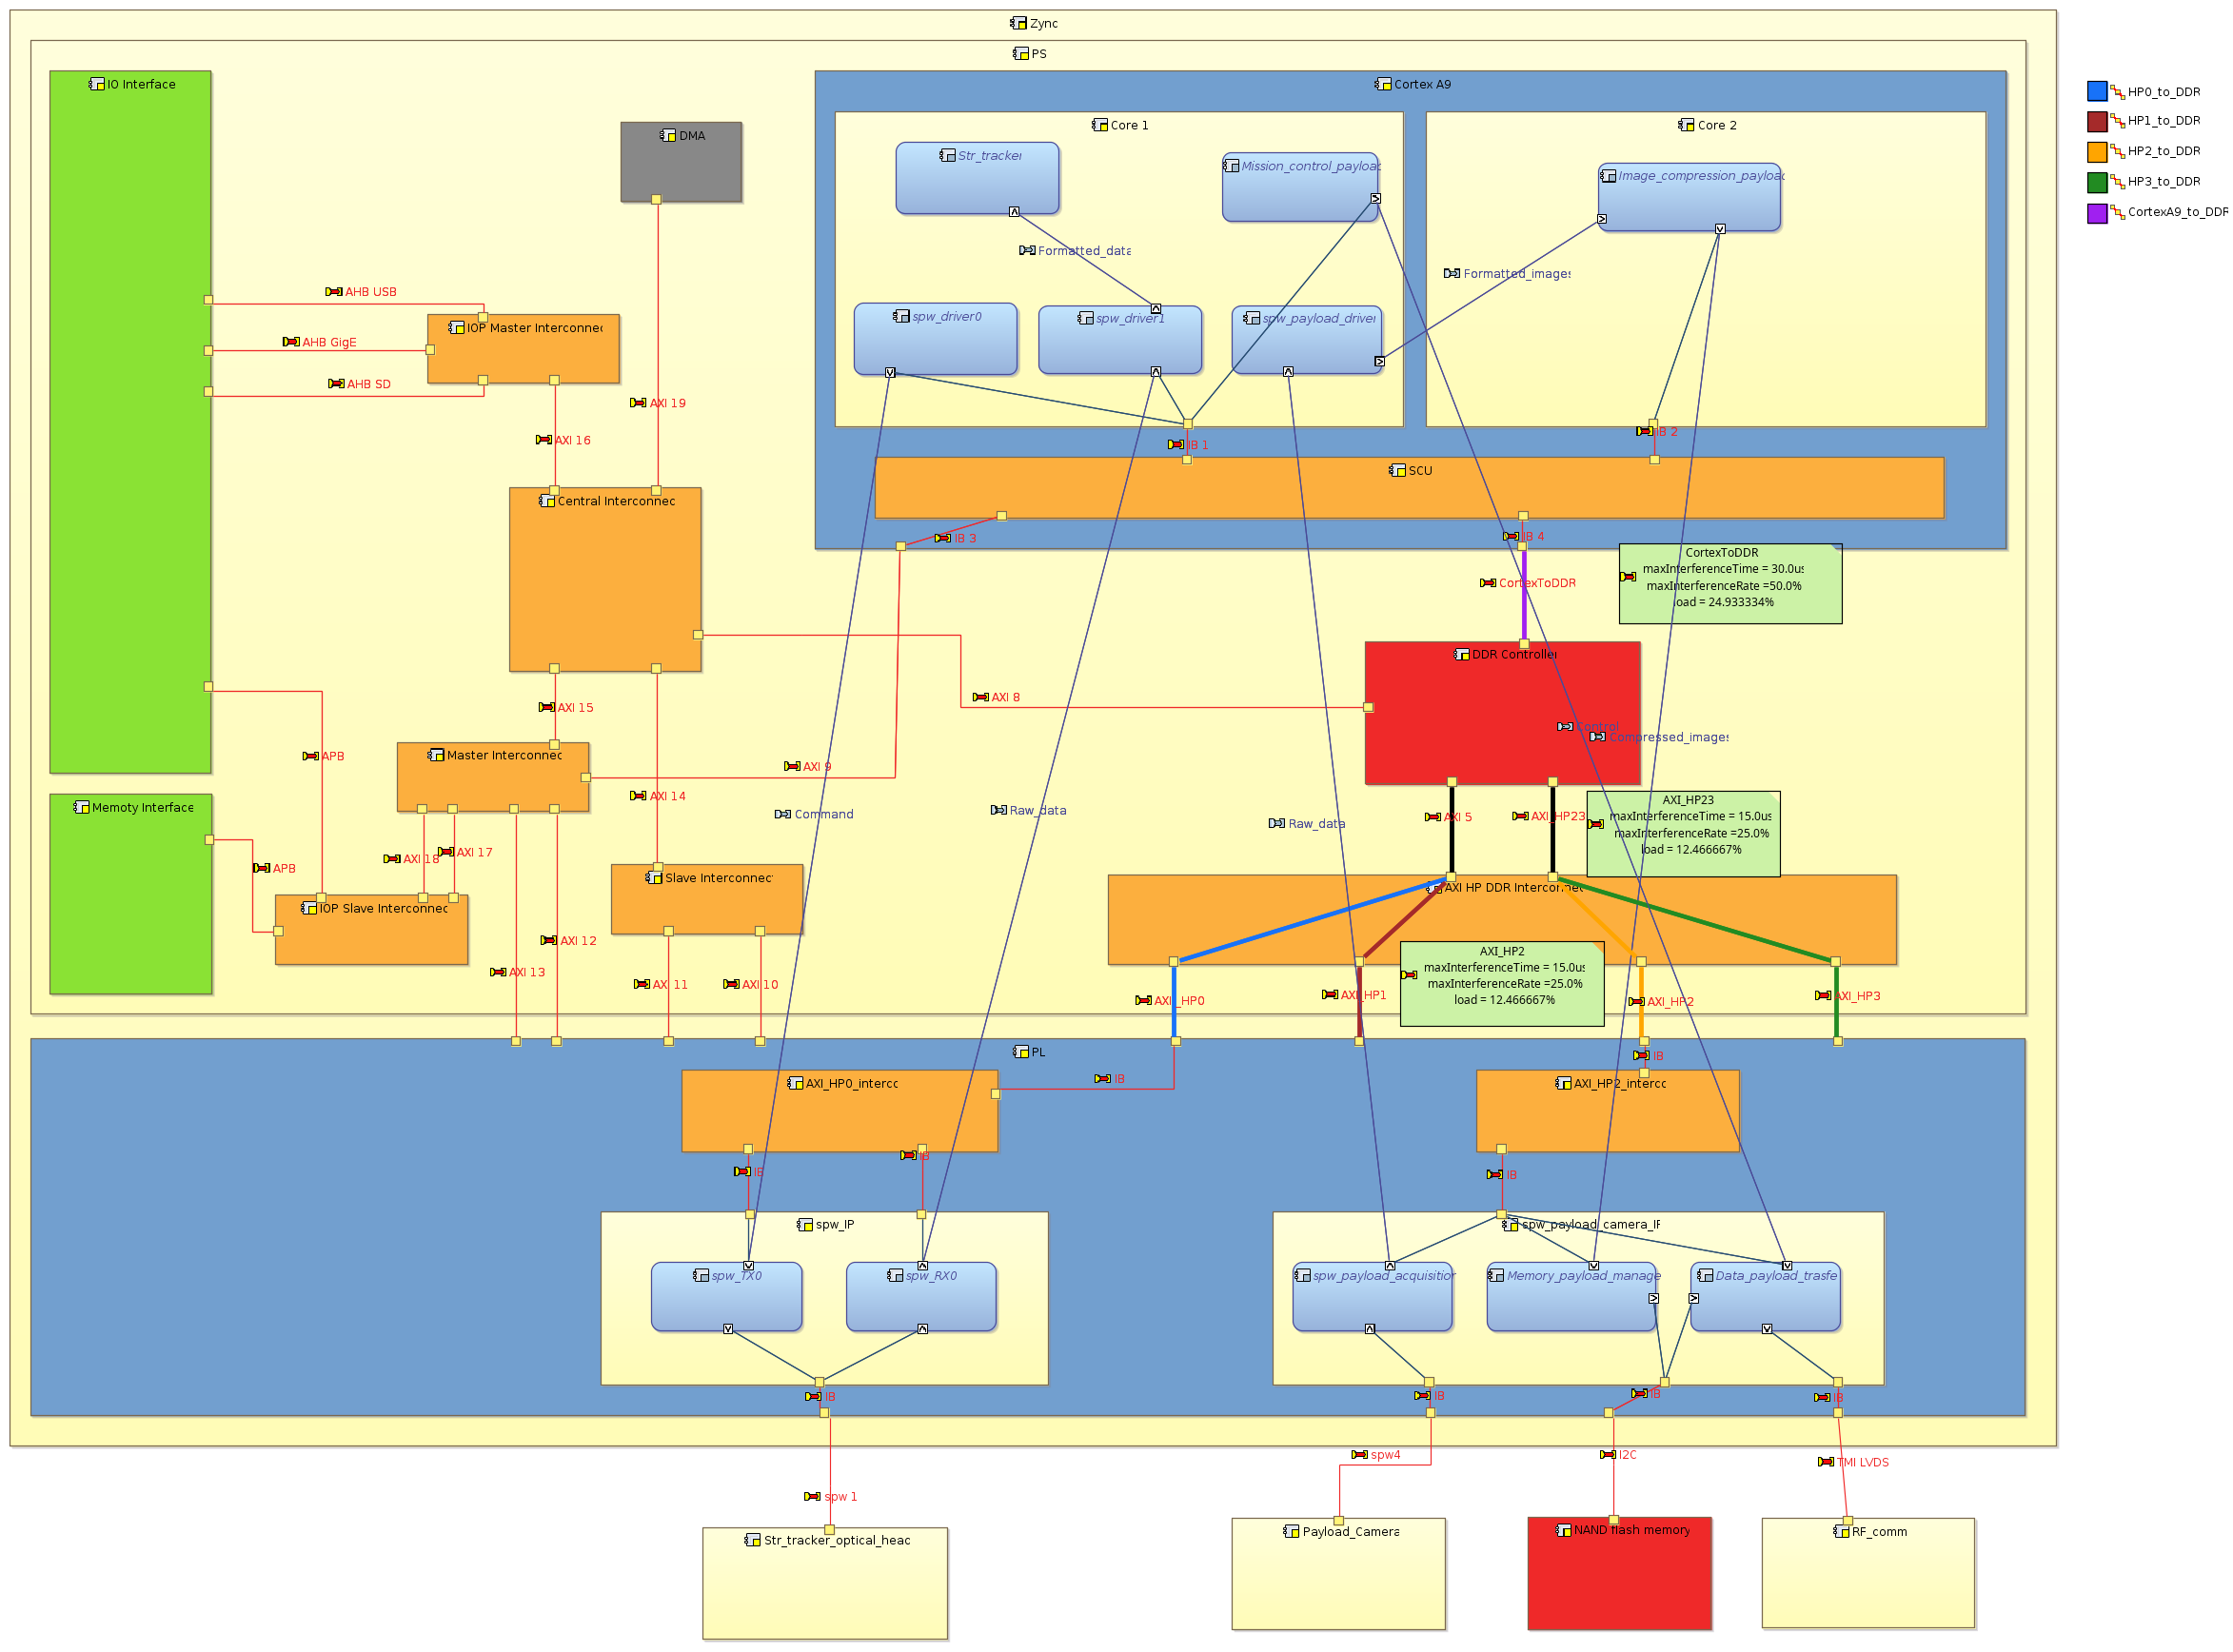
In the following, we show the results of 2 different strategies of image compression. In the first screenshot, we present the results in terms of bus load and interference percentage of a configuration where compression algorithm is configured to execute on an input of 2 images at each run. And the second screenshot shows the same kind of results for a configuration where the compression task is executed on a group of 4 images. As the first strategy consumes less data, the schedule is twice faster then the second strategy. However the overall consumed and generated data is the same, considering the slowest frequency.
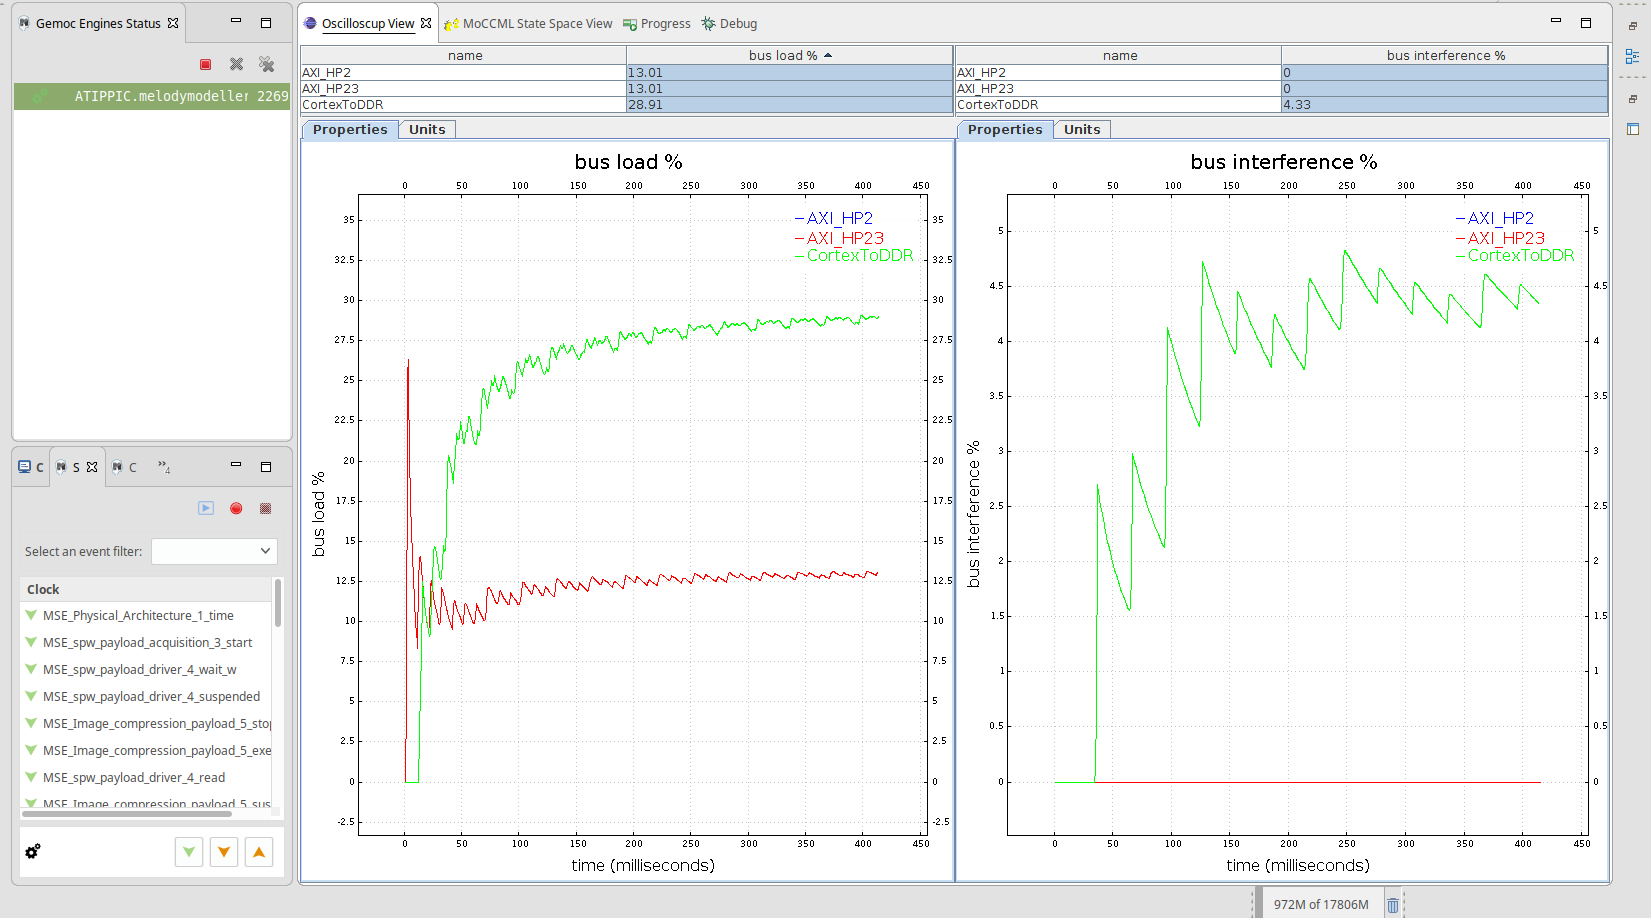
2 images compression strategy
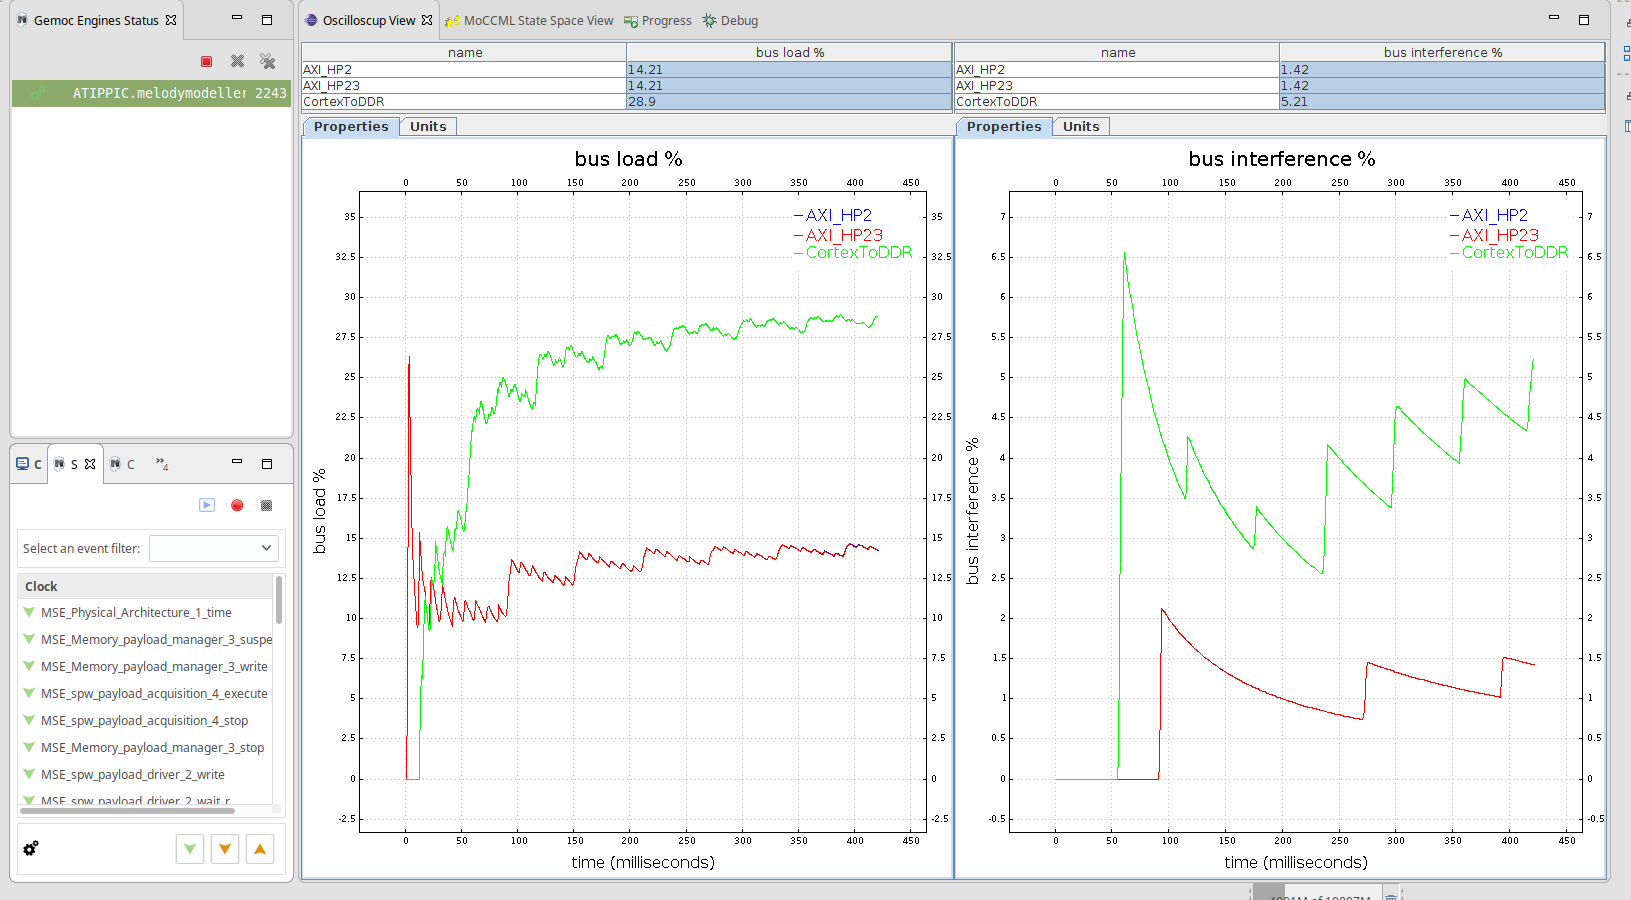
4 images compression strategy
As the overall exchanged data in the model is the same for the 2 configurations, bus load isn’t affected by using one strategy over another. The difference between is observed on the interference rate where the first strategy generates less interference than the second one.
Design space exploration
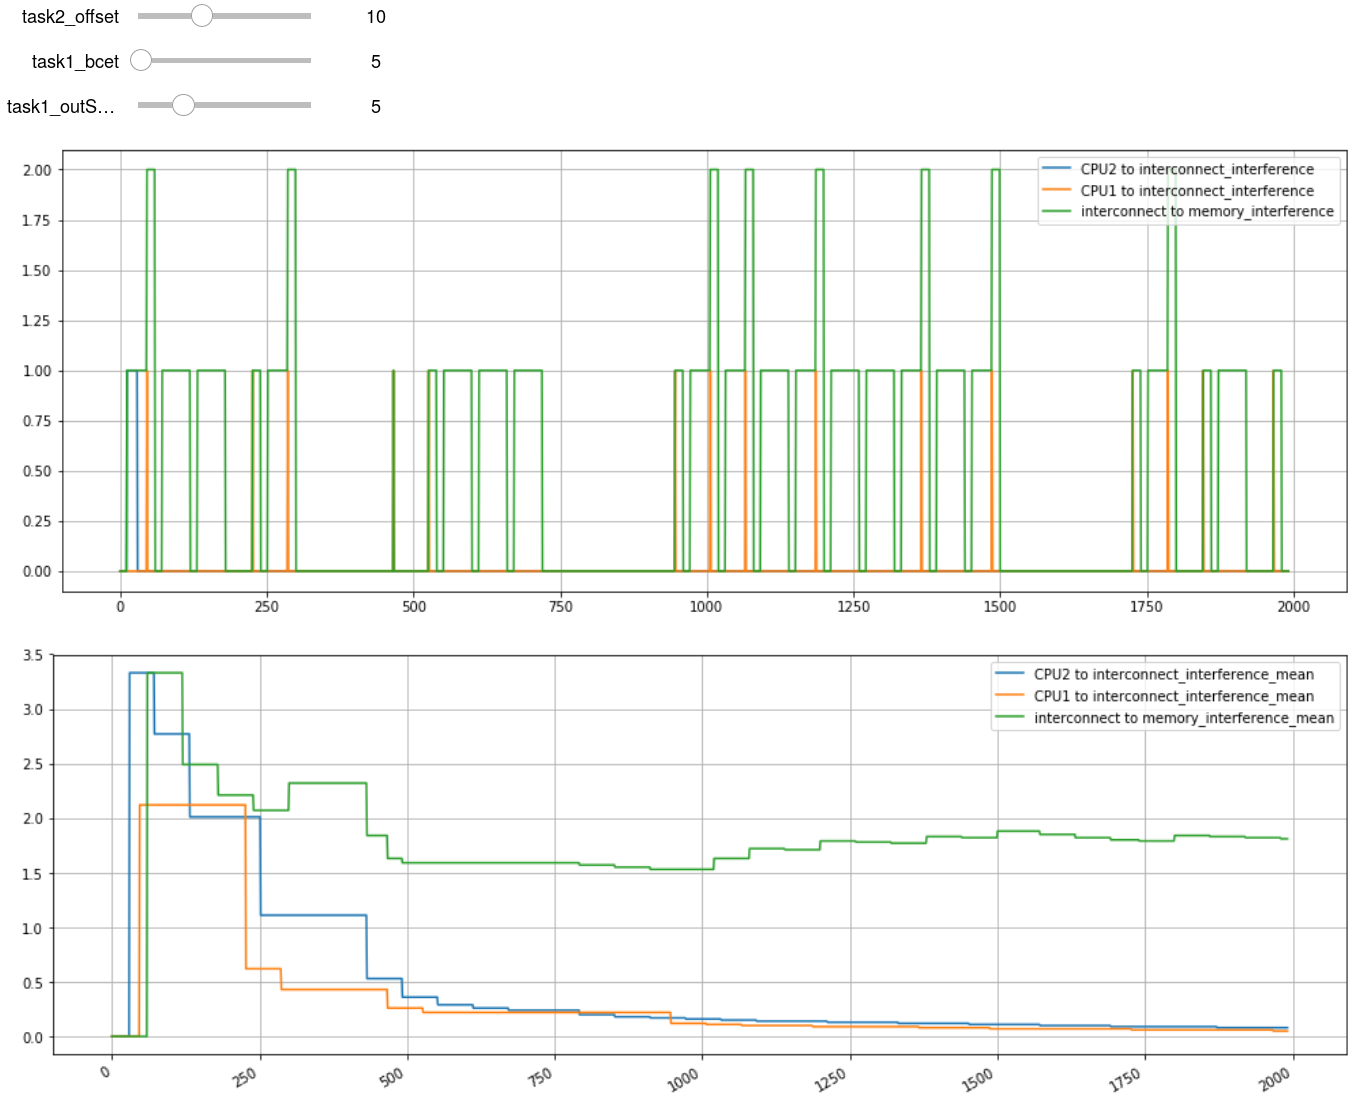 Simple Interface for Exploration of the Simulation Results
Operational analysis results
Results of operational analysis show the worst case for the two precedent scenarios. The analysis doesn’t take into account the schedule information such as execution frequency and offsets, it only consider communication time and possible overlap.
operational analysis results of 2 images compression strategy
operational analysis results of 4 images compression strategy