


The code for the baselines is available at https://github.com/robustml-eurecom/stressID.
Unimodal and multimodal baselines combine features extracted from video, audio, and physiological inputs. The models are trained to perform binary classification, i.e. discriminate between stressed and not stressed, as well as 3-class classification. These discrete labels are extracted from the self-assessments of the subjects.
For the binary classification, not stressed vs. stressed is predicted.
- “not stressed” (0) is given for stress < 5.
- “stressed” (1) is given for stress ≧ 5.
For the 3-class classification, relaxed vs. neutral vs. stressed is predicted.
- “relaxed” (0) is given when valence > 5, arousal < 5 and relax > 5.
- “stressed” (2) is given when valence < 5, arousal > 5 and stress > 5.
- “stressed” (1) otherwise.
Our analysis confirm that the labels and the acquired data are coherent and meaningful, stress can be predicted in binary and 3-class classification.
| Baseline (#tasks) | Binary stress | 3-class stress |
| Physiological (711) | 0.75±0.04 | 0.55±0.04 |
| Video (587) | 0.62±0.07 | 0.48±0.01 |
| Audio-HC (385) | 0.67±0.04 | 0.53±0.06 |
| Audio-DNN (385) | 0.72±0.07 | 0.53±0.09 |
| Multimodal (385) | 0.64±0.07 | 0.42±0.03 |
FEATURES
Physiological Signals.
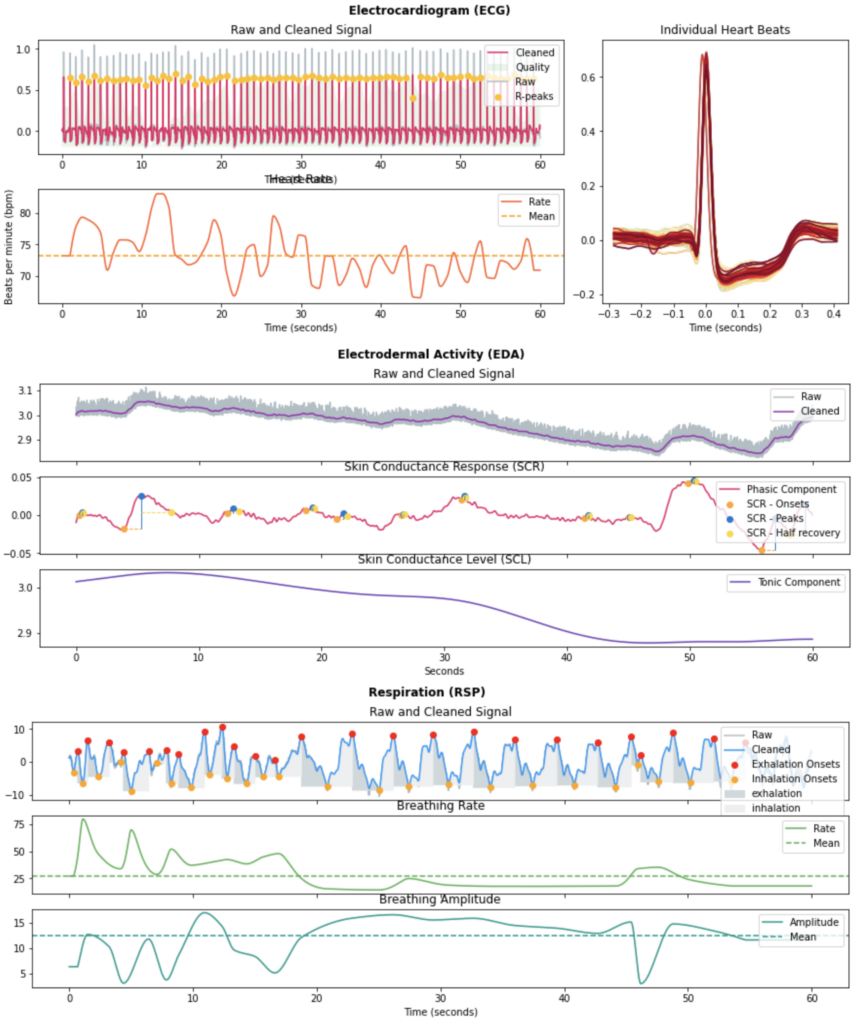
For ECG, 35 features are extracted.
These include HRV features in the time domain including the number of R to R intervals (RR) per minute, the standard deviation of all NN intervals (SDNN), the percentage of successive RR intervals that differ by more than 20ms and 50s (pNN20 and pNN50), or the root mean square of successive RR interval differences (RMSSD), as well as frequency domain, and non-linear HRV measures.
For EDA, 23 features are extracted.
We have extracted statistical features of the Skin Conductance Level (SCL) and Skin Conductance Response (SCR) components of the EDA, including the slope and dynamic range of the SCL, along with time domain features including the number of SCR peaks per minute, the average amplitude of the peaks, and average duration of SCR responses.
For respiration 40 features are extracted.
We have extracted Respiration Rate Variability (RRV) features in time and frequency domain.
The physiological features representation is done with the neurokit2 package.
Video Data.
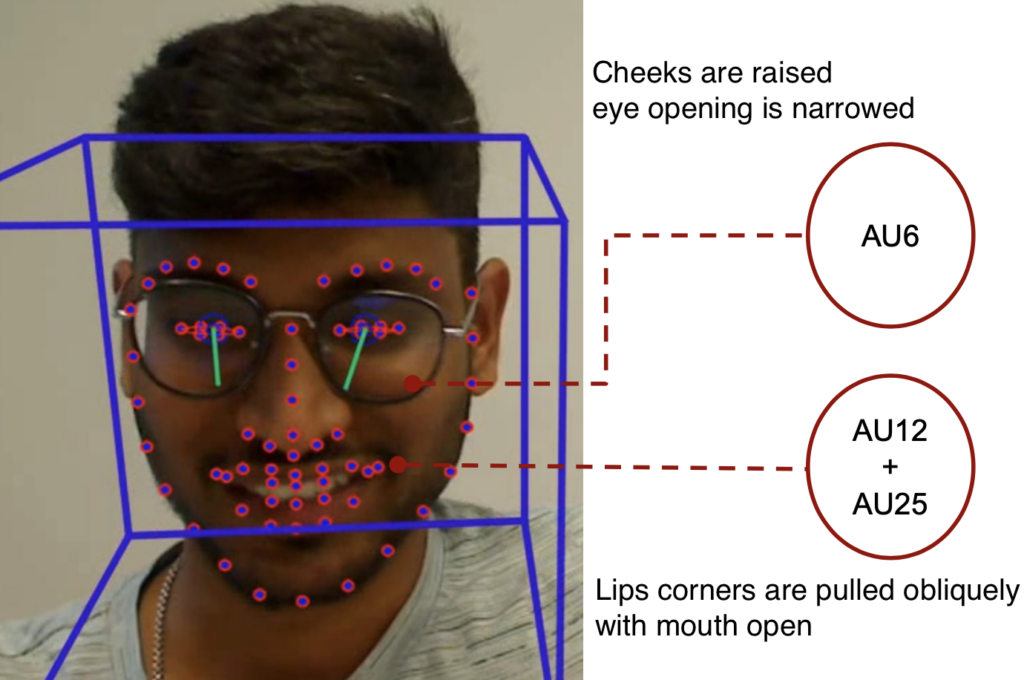
For video, 84 features are extracted.
Mean and standard deviation of action units (AUs) and eye gaze are the video features. AUs and eye gaze are extracted with OpenFace from each video frame.
Extracted AUs: 1, 2, 4, 5, 6, 7, 9, 10, 12, 14, 15, 17, 20, 23, 25, 26, 28, and 45.
Two AUs extracted with OpenFace on a sample frame.
Audio Data.

For audio, 140 and 513 features are extracted.
Two approaches for speech signals analysis are proposed.
1) Audio-HC, employing hand-crafted features. Among others, Mel Frequency Cepstral Coefficients (MFCCs) and their first and second derivatives are extracted, together with spectral centroid, bandwidth, contrast, flatness, and rolloff. The mean and standard deviation over time for all features is extracted, resulting in a feature vector of 140 components.
2) DNN feature extraction, employing pre-trained Wav2Vec (W2V) model. Features are extracted every 20 ms and are averaged over time to obtain a single 513-component embedding per utterance.
The MFCCs representation of Audio Features.
Multimodal data.
The multimodal baseline is done by early fusion; the 3 kinds of features (Audio-HC for the audio data) are concatenated at the input.
CLASSIFICATION
For Physiological signals, best results are achieved with Recursive Feature Elimination (RFE) algorithm combined to a L1-penalised logistic regression.
For Video data, best results are achieved combining L1 feature selection with a Random Forest classifier with a maximal tree depth of 5.
For Audio data, best results are achieved with a linear classification layer optimised with Adam and cross-entropy loss.
For the baseline, best results are achieved with Multi Layer Perceptron (MLP) with ReLU activation functions optimised with Adam and cross-entropy loss.
EXPERIMENTS
In all the experiments, we generate 8 random splits, using 90% of the subjects for training, and 10% for testing for each split. The results are averaged over the 8 repetitions. To ensure robustness to potential imbalance resulting of the train-test splits, the results are assessed using the weighted f1-score on the test data.