
Neural Coding:
progress report (November 2012-November 2016)
Events
September 2012: 1st “Neural Coding” seminar. Brest. 40 participants
September 2012: Positive answer from the Committee For Protection of Persons (CPP, (support from CHU Rennes)
December 2012: Authorization from ANSM to record from normal subjects (French national agency)
February 2013: First HR-EEG recordings in normal subjects
June 2013: Participation to the Brain Connectivity Workshop, Vancouver, CA (M. Hassan).
June 2013: Presentation of the “Neural Coding” project (Oral and poster presentation) during the CominLabs Week, Rennes.
June 2013: Installation of the GPS system for automatic electrode registration (financial support from CominLabs)
June 2013: 2nd “Neural Coding” seminar, Brest. 50 participants
November 2013: “Neural Coding” meeting, Rennes. 20 participants
Mars 2014: A. Mheich (PhD student): visiting fellowship at the LabSTICC (two weeks)
June 2014: Participation to the Organization of Human Brain Mapping -OHBM- international conference, Hamburg, Germany, 2014 (M. Hassan and O. Dufor)
June 2014: Participation to the Brain Connectivity Workshop, Hamburg, Germany, 2014 (M. Hassan and O. Dufor)
June 2014: Participation to the 9th GRETSI summer school ” Traitement du signal et des images en grandes dimensions”, Peyresq (A. Mheish).
June 2015: Participation to the Brain Connectivity Workshop, Hamburg, San Diego, 2015 (M. Hassan)
June 2015: Participation to the Organization of Human Brain Mapping -OHBM- international conference, Hawaii, 2015. (M. Hassan).
July 2015 Participation to the Summer School Course:” Exploring the Human Connectome”, Utrecht (A. Mheich and M. Hassan).
Septembre 2015: Participation to the ’25ème édition du colloque GRETSI’, Lyon (M. Hassan, F. Wendling and V. Gripon).
June 2016: Participation to the Brain Connectivity Workshop, Hamburg, Marseille, 2015 (A. Mheich and Aya Kabbara).
June 2016: Participation to the Organization of Human Brain Mapping -OHBM- international conference, Geneva, 2016. (A. Mheich and Aya Kabbara).
Septembre 2016: Participation to the 3rd Middle East Conference on Biomedical Engineering ,MECBME’16, Beirut, (Rizkallah Jennifer).
Introduction
According to the mental information theory developed by C. Berrou, information coding in the brain involves “small” neural networks, called “neural cliques”. Neural cliques can be viewed as complete graphs whose topology is an essential feature in the encoding and retrieval of “infons” (i.e. elements of information).
The objective of the Neural Coding project (Labex Comin Labs) is to evidence the presence of cliques and meta-cliques (“cliques of cliques”), in human subjects performing a cognitive task related to working memory. A unique feature of the project is to make use of a high-resolution EEG system (HR EEG1, 256 electrodes) to record brain activity in these subjects.
During the past two years, we mainly focused on the processing of EEG (Electroencephalographic) signals to identify cortical networks.
In particular, progress was accomplished on three main aspects:
– The development of a neuropsychological task involving working memory (recognition of an object in an image and naming / spelling the name of this object)
– The recording of EEG signals from healthy subjects performing this task,
– The development of signal processing methods to i) Reconstruct the cortical sources from scalp potentials and ii) Measure the functional connectivity among these sources. This step followed a preliminary analysis of the functional connectivity measured on signals collected at the level of electrodes.
Regarding the third point, the recent past years have seen a noticeable increase of interest for electroencephalography (EEG) to analyze functional connectivity through brain sources reconstructed from scalp signals. Although considerable advances have been done both on the recording and analysis of EEG signals, a number of methodological questions are still open regarding the optimal way to process the data in order to identify brain networks.
So far, our efforts were focused on three main aspects:
- We analyzed the impact of three factors that intervene in this processing: i) the number of scalp electrodes, ii) the combination between the algorithm used to solve the EEG inverse problem and the algorithm used to measure the functional connectivity and iii) the frequency bands retained to estimate the functional connectivity among neocortical sources. The output of this part is the optima combination of the tested parameters.
- We used the best combination derived from part (A) to analyze the dynamics of the functional brain networks during the cognitive task.
- We investigated the presence of complete graph during the cognitive task (denoted as macro clique). The aim of this part is to build a link with ‘neural clique’ as defined the mental information theory.
Identification of brain networks using dense EEG
Our evaluation methodology involves three main aspects:
a- The inverse algorithm used to estimate the cortical sources and reconstruct their temporal dynamics.
b- The connectivity method used to assess statistically significant functional relationships between the temporal dynamics of sources.
c-The cognitive task performed by the subject, which is supposed to activate relatively well-defined brain networks.
The different steps of this comparative analysis are summarized in figure 1. In step 1, the lead field matrix is estimated using the boundary element method (BEM) based on i) a high-resolution 3D mesh of the white/grey matter interface for the source model and on a realistically-shaped head model (3 layers) for the volume conductor, both obtained from MRI data segmentation.
In step 2, the temporal dynamics of dipolar cortical sources are estimated from scalp EEG signals which consist in Event Related Potentials (ERP) recorded during a picture recognition and naming task. Four methods (MNE, wMNE, LORETA, sLORETA, see figure 1 for abbreviations) are used to estimate sources. Two montages (using either standard or high-resolution montage) were used to analyze the effect of the number of electrodes on the inverse solution results.
Then, in step 3 the functional connectivity among cortical sources is computed according to a pair-wise approach using five different methods (R², sPLV, MI, ImC and PE, see figure 1 for abbreviations). Functional connectivity is calculated in two frequency bands beta (14-30 Hz) and low gamma (30-45 Hz) and over the (>200ms) time window. Finally, in step 4, the performance of each method (source reconstruction + functional connectivity) is evaluated against its capacity to identify a network “topologically close” to that expected in the considered task. For this purpose, we proposed two criteria based on the definition of 7 (4 left and 3 right) distinct regions of interest (ROIs) reported to be involved in the cognitive task performed by the subjects.
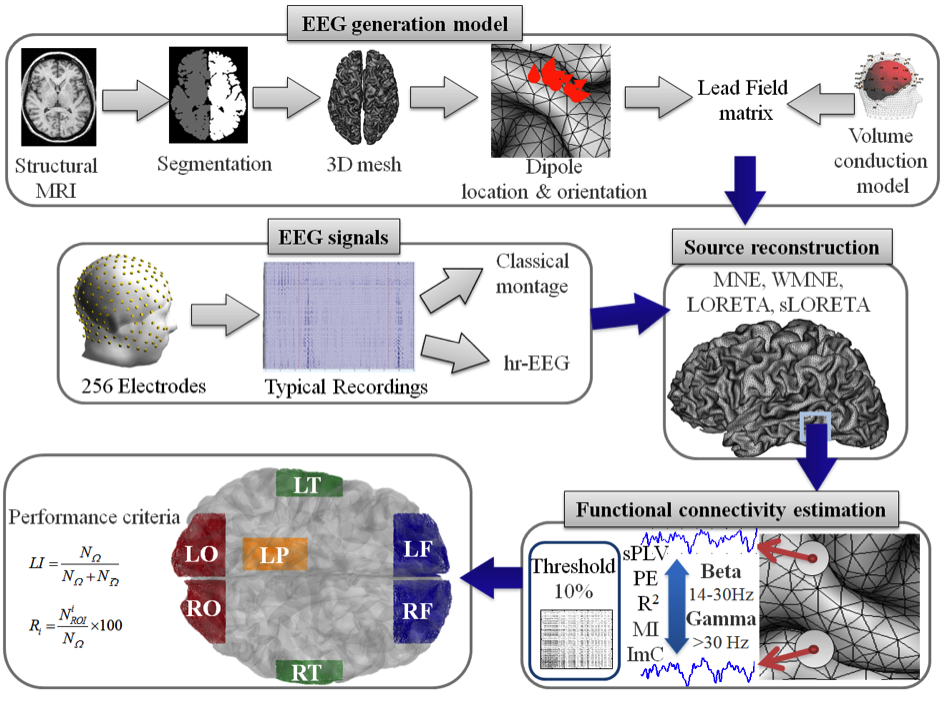
Figure 1. The different steps of the comparative study. Abbreviations: hr-EEG: high-resolution EEG, MNE: Minimum norm estimate, wMNE: Weighted Minimum norm estimate, LORETA: Low resolution Brain Electromagnetic Tomography, sLORETA: Standardized Low resolution Brain Electromagnetic Tomography, sPLV: single-trial Phase Locking Value, PE: Phase Entropy, R2: linear correlation coefficient, MI: Mutual Information, ImC: Imaginary Coherence ROIs: Regions of Interest, LO: Left Occipital; RO: Right Occipital, LT: Left Temporal, RT: Right Temporal, LF: Left Frontal, RF: Right Frontal, LP: Left Parietal (adapted from Hassan et al., PLoS ONE, 2014).
Our results show that the three studied factors have a dramatic impact on the final result (the identified network in the source space) as strong discrepancies were evidenced depending on the methods used (Figure 2). They also suggest that the combination of weighted Minimum Norm Estimator (wMNE) and the Phase Synchronization (PS) methods applied on High-Resolution EEG in beta/gamma bands provides the best performance in term of topological distance between the identified network and the expected network in the above-mentioned cognitive task (figure 3).

Figure 2. Connectivity graphs obtained by using the different inverse and connectivity methods for hr-EEG. Red and blue lines denote the functional connectivity as measured in the gamma (> 30 Hz) and beta (14-30 Hz) frequency band respectively (adapted from Hassan et al., PLoS One, 2014).
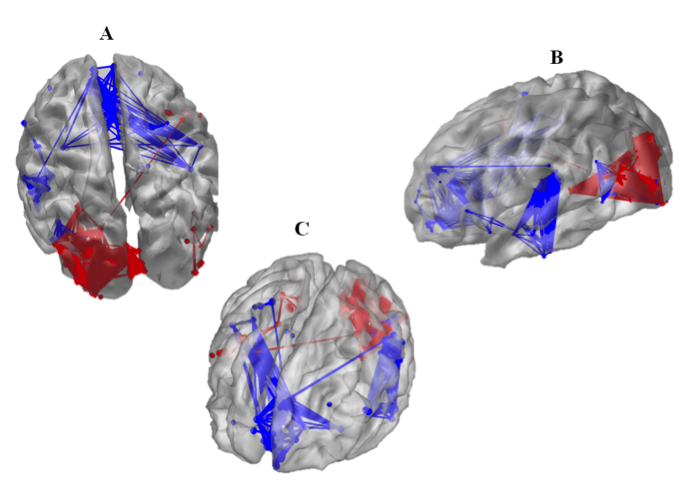
Figure 3. Typical example of the brain network identified using wMNE and sPLV in the picture recognition and naming task. A: lateral view B: Top view C: frontal view (adapted from Hassan et al., PLoS One, 2014).
Tracking the spatiotemporal dynamics of functional brain networks
Very recently, we have proposed a new algorithm to track the dynamics of functional brain networks. During a picture naming task, this algorithm aims at segmenting high-resolution EEG signals (hr-EEG) into functional connectivity states (Mheich et al. 2015). The proposed algorithm is based on the K-means clustering of the connectivity graphs obtained by using the best combination of factors (inverse problem, connectivity measure, number of electrodes and frequency bands) retained from section A. Results showed that the cognitive task can be divided into six clusters representing distinct networks sequentially involved during the cognitive task, from the picture presentation and recognition to the motor response (figure 4).
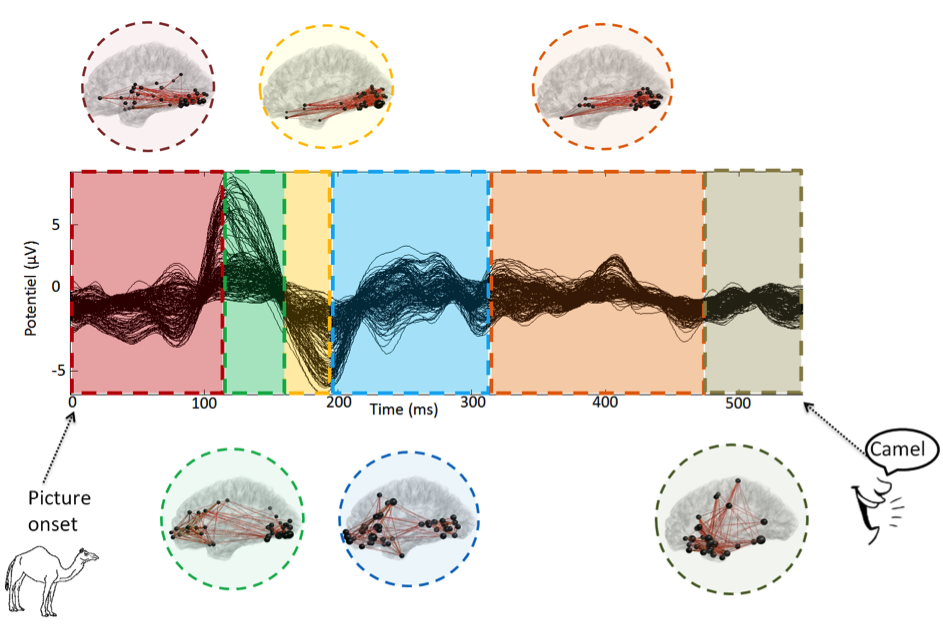
Figure 4: Results of the tracking process. Event related potentials for the picture naming task and distribution of the functional connectivity graphs revealed by the proposed spatiotemporal segmentation algorithm. The results are shown from 0 ms (the Onset when the visual stimuli were presented) to 535 ms when the naming process starts., (Hassan et al. cortex 2015).
Discussion and perspectives
With the accomplished work (elaboration of a cognitive task + recordings in 21 subjects + signal processing), we could demonstrate the existence of an occipito-temporo-frontal network which activates during the recognition and naming of picture presented on a screen.
It should be noted that these results are extremely encouraging. We could identify different densities of nodes and edges (which vary from one region to another) that suggest the presence of large-scale networks involving both short-range (within regions) and long-range (across regions) connections in the brain.
It is also worth mentioning that these networks are consistent with those reported in the literature, from other modalities of neuroimaging (fMRI, PET) and that there are very few similar studies (brain connectivity from scalp EEG signals) so far. As expected in right-handed subjects, the activated system is predominantly left and identified cortical areas seem relevant to the functions involved (visual association, image interpretation, recognition, attention and working memory).
These results open up many perspectives related to key issues in the field (methodological and neuroscientist’s aspect) including:
– The influence on the graphs identified and inverse methods of the EEG and the connectivity measurements,
– The development of methods for reducing the complexity of graphs (sparse graphs),
– The analysis of the links between network topology and the semantic content of the presented information
– The analysis of the relationship between network topology in the visual cortex and the characteristics of stimulus (information content in the image).
At this stage, we also realized that an essential step in this project should consist in the characterization of identified graphs. Indeed, there are many sources of variability in the results:
– Variability associated with estimators (ill-posed inverse problem, connectivity methods based on different underlying models)
– Intra-subject variability when objects of different categories are presented
– Inter-subject variability performing the same task inherent in any experimental approach in humans.
Consequently, with the partners of the Neural Coding project, it was decided to put some effort on methodological developments aiming to evaluate distances between graphs. A PhD thesis started in November 2013 on this topic (PhD student: Ahmad Mheich).