
Current results
The progress of the project since its beginning (July 2013) up to November 2016) is described here.
1. RFID Pervasive test bed
An important achievement of the project has been the design and implementation of a flexible RFID testbed enabling the accurate reproduction of a a wide range of RFID reading conditions. This allows accurate and reproductible experiments of adverse RFID reading situations, in particular those matching pervasive computing applications and uncontrolled environments. The testbed was designed to support mobile RFID targets and arbitrary tag to antenna orientation.
The RFID Pervasive test bed consists of three main building blocks: RF system (reader+antennas), engines to move antennas, and portal. The antenna systems are located along three linear axes, two on both portal lateral sides and one on the top. The metallic portal is used to support antenna systems and engines. The entire system is numerically-controlled, especially to drive antennas along conveyors, volume with tags and reader.
The main specifications of the test-bed are provided below
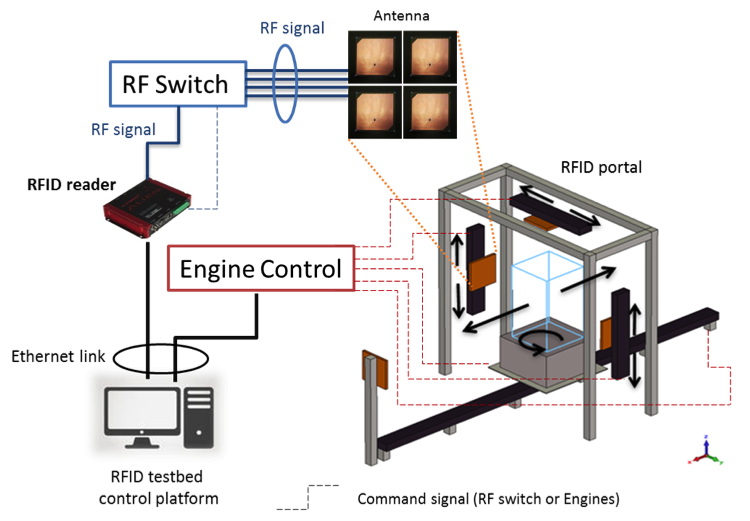
Fig. 3. Illustration of the proposed RFID test-bed
Goal:
- Empirically study and characterize challenging RFID situations;
- Test innovative RFID antenna systems that fit challenging RFID situations;
- Test novel RFID protocols that combine physical with logical solutions.
Structure:
- A mechanical part: (i) portal structure, (ii) linear guide rails, and (iii) motion engines;
- A RFID part: (i) RFID reader, (ii) associated antennas, and (iii) RFID tags.
- A software part: RFID test-bed control platform.
Main mechanical specifications based on industrial portal:
- Dimensions (max.) : 2.5m high, 2.6m width and 6m length;
- 5 engines (with rotary one) with accuracy and repeatability in positioning.
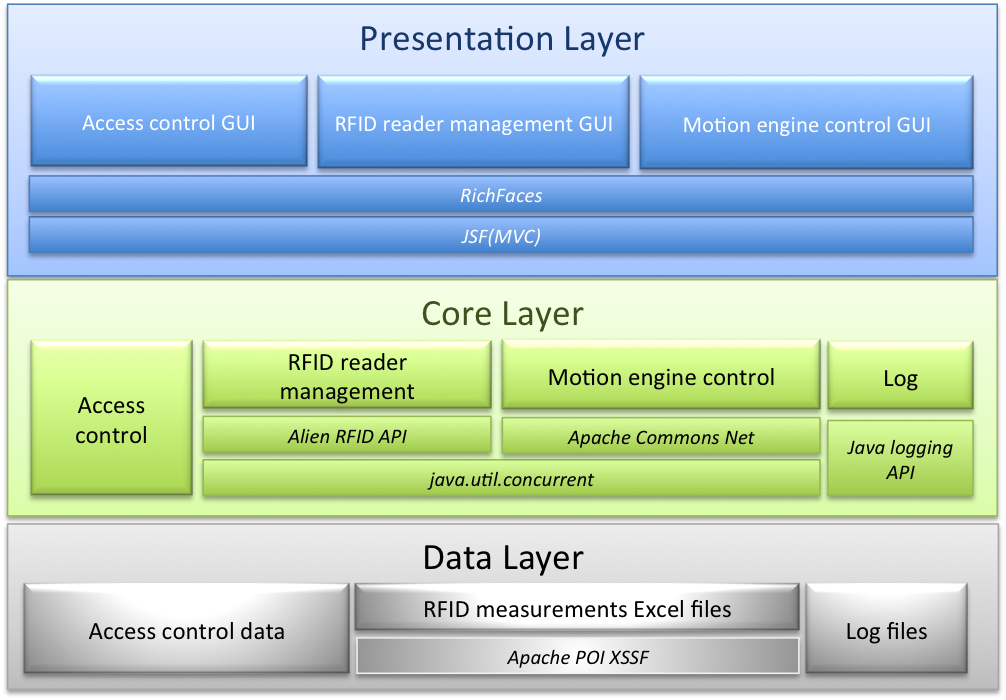
RFID testbed control platform
INRIA designed and developed the custom software for controlling the motion control and the RFID readers. The software architecture is presented below:
 A huge amount of efforts was devoted to make this test-bed operational. Its definition started in Sept. 2013. The test-bed was installed in the laboratory in fall 2014.
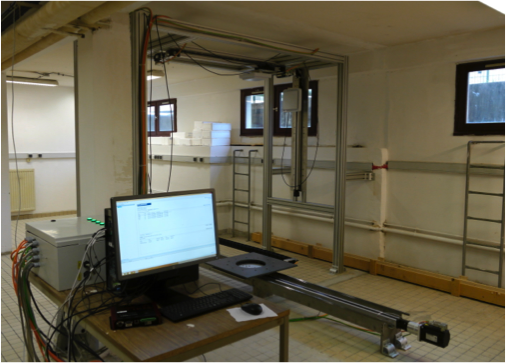
Integration and test of the control software were completed during 2015. Additional requirements were identified during the initial tests, in order to have better scripting capabilities for supporting experimentation, as well as improving the robustness and ease of use of the platform to make it a fully operational tool. A second version of the software platform was developped in 2016, providing full programmatic control of experiments and scenarios in Python 3. A first version was deployed in july 2016.
2. Antenna design for Pervasive RFID
RFID Pervasive investigates versatile and low-cost reader antennas for RFID applications. Below, we describe the two parts of our antenna system: the feed network and the antenna array. The originality of this work is based on the versatility and then the diversity capabilities offered by an antenna system which must be kept as simple as possible with a very low-cost feed network (next figure).
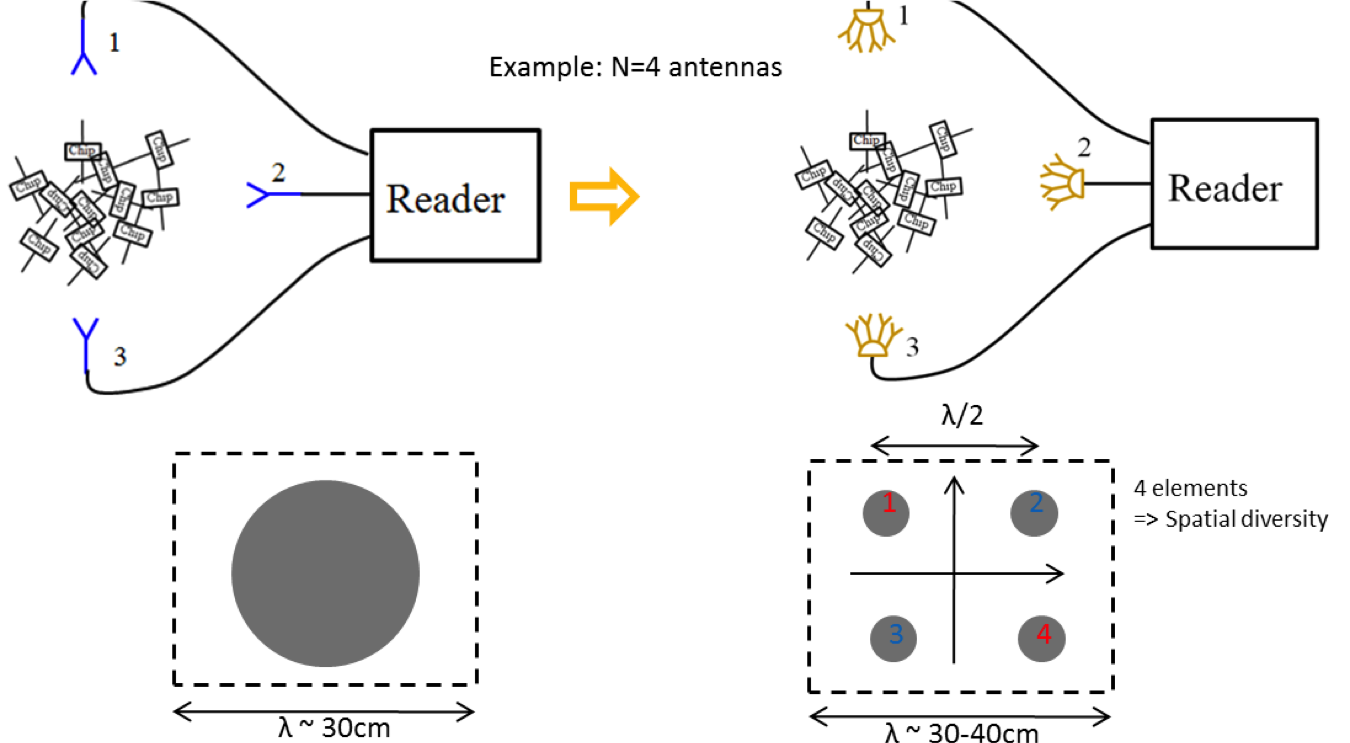
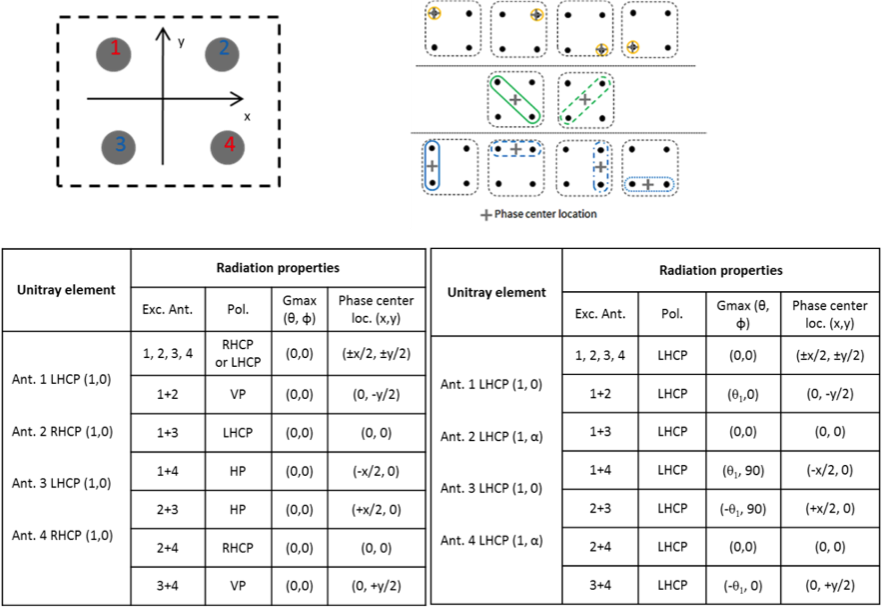
Fig. 4. Spatial diversity possible implementation in UHF RFID portal case – System view (top) Unitary element view (bottom).
Versatile antenna system for UHF RFID portal applications
Diversity capabilities of a 2×2 array
The figure 5 depicts the combination schemes that can be achieved using the proposed feed network, namely (i) spatial diversity by feeding either one single antenna element or two antenna elements (in this case, the phase center location is different), (ii) polarization diversity, possibly combined with spatial diversity if diagonal elements have a different polarizations, for example, left-handed circular polarization (LHCP) and right-handed circular polarization (RHCP), (iii) pattern diversity by combining radiation of two elements. As a summary, the proposed antenna system offers ten different states, thus leading to a wide variety of scene illuminations. Moreover, the use of phase shifters would allow scanning the antenna beam in different directions, although this solution is not preferred for cost purposes.
 Diversity combination examples enabled by the proposed feed network and a 2×2 array antenna.
Proposed 2×2-element array
A lot of UHF RFID antennas have been proposed in the open literature, e.g. [3-8]. The main requirements for RFID portal antennas are the following: low cost antennas preferably operating in circular polarisation with a typical gain value of 6dBi in order to comply with normative EIRP [9]. The 2×2 array and its beam forming network are represented in Fig. 6. The radiating part is a 2×2 element square antenna array. Patch antennas fulfill these requirements and are good candidate here. A truncated printed patch antenna has been chosen as unitary element. The main feed line connected to the RFID reader is split into four branches to feed individually the four radiating elements. Reflective switches are used to excite or not each of the radiating elements. Design and performances of patch antenna and feed network are described in details here: Design of unitary antenna and feed array. Such an architecture enables one to feed unitary elements separately or to combine several elements.
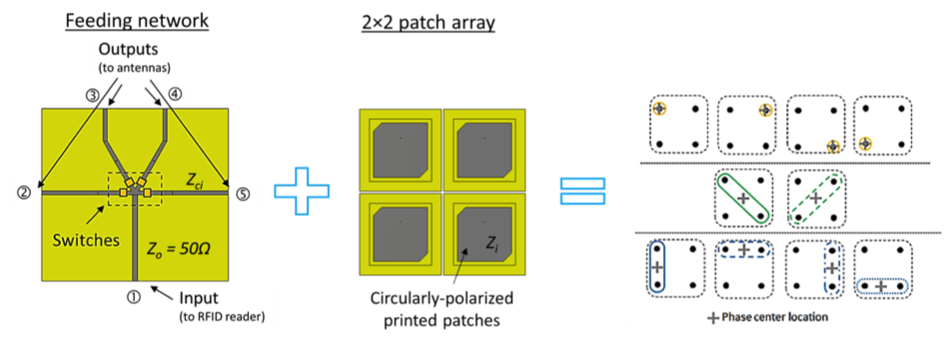
Fig. 6. 2×2 array with beam forming network
Examples of patterns diversity are provided in figure below. Broadside direction, scanned dual beams or pencil beams are examples of achievable patterns.
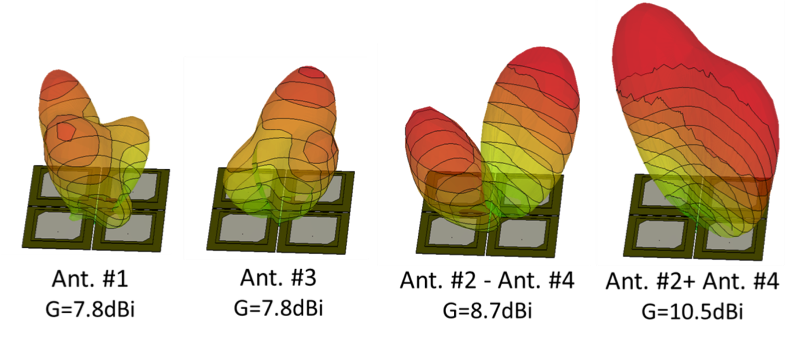
Fig. 7. Example of 3D radiation patterns
Design and optimization of the 2×2-element array
Here the simulation setup takes into account the feed network and the antenna array and coaxial probes between them (SMA 50Ω). The reflection coefficients computed for each radiating element are represented in Fig. 8. The antenna is well matched in UHF RFID band (S11 < -20dB in the frequency range [851-881] MHz). Despite structure dissymmetry, one can notice that reflection coefficients are very close from one element to the other one. This indicates that inter-element coupling is quite low. This has been confirmed by additional simulation results without feed network where the mutual coupling scattering parameters Sij (i¹j) are below -20dB. Besides, radiation patterns are similar whatever is excited patch antenna. Fig. 9 compares -1dB and -3dB contour plots when the four patches are excited separately and the other are open circuited.

Fig. 8. Computed reflection coefficients of {feed network + cables + antenna} system in the four considered states (ant. 1 excited, ant. 2 excited, ant. 3 excited, ant. 4 excited)

Fig. 9. (a) 3D Radiation pattern and -1dB and-3dB contour plots of Antenna #1 when the other ones are open circuited (b) -1dB and-3dB contour plots of each antenna.
This similarity is not ideal to optimize spatial diversity but it must be reminded that spatial diversity does not depend exclusively of radiation pattern. Indeed, antenna environment clearly modifies radiation patterns and emphasizes the space diversity as shown below if we take into account the portal structure.
Impact of the portal on pattern diversity
It should be mentioned that the real antenna environment must be taken into account to study pattern diversity. Indeed, antenna arrays are placed upon a rail and a metallic slab, part of the portal assembly. 3D EM simulations have shown that radiations patterns are modified (Fig. 10) and each unitary antenna illuminates different areas when those metallic elements are taken into account.
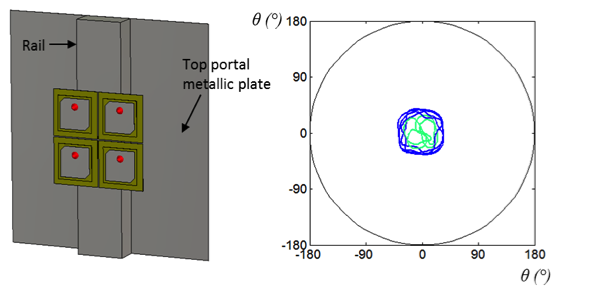
Fig. 10 -1dB and -3dB representation when antenna system close environment is taken into account.-1dB areas are then different from one patch to another.
Manufacturing of antenna prototypes is currently in progress.
Numerical analysis of the UHF RFID portal and
numerical testing platform
To validate performances of the antennas developed for pervasive scenarios, the entire RFID portal has been modeled. This task is very challenging due to the complexity of the electromagnetic problem under test (overall dimensions, multi-scale problem, etc.). Many different tests have been conducted to find the suitable numerical settings to provide reliable results in a reasonable computation time (multi-CPU workstation with GPU cards).
The objective of these numerical models is twofold. The first one is to understand wave propagation mechanisms in such a complex, but realistic, environment; the main metric used in these cases are near-field distributions in 3D. The second objective is to use this numerical testing platform to speed-up future antenna developments and assess new antenna concepts without any prototyping. Statistical results are extracted from electromagnetic simulations, and contribution of antenna diversity is characterized in terms of field coverage. The simulation results will be compared with experimental results in well-controlled and reproducible scenarios. This will allow tuning the numerical model in order to use, in the near future, this numerical testing platform to predict the performance of RFID systems in ‘uncontrolled’ situations. This platform constitutes a very versatile and powerful tool for research and industrial applications.
Numerical modeling of the UHF RFID portal
The simulation model is composed of three main parts (Fig. 11): the detailed antenna systems, the RFID portal and the surrounding environment. The antenna systems are located along three linear axes, two on portal lateral sides and one on the top.
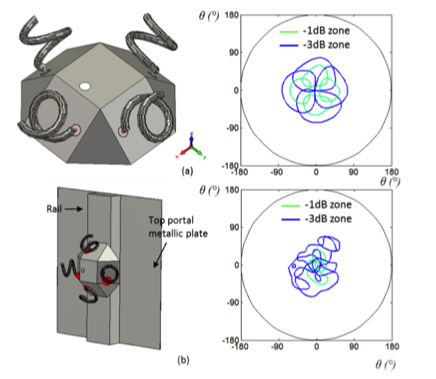
Fig. 11. UHF RFID portal modelling (a) Overview and external dimensions in millimeters (b) Antenna systems and portal dimensions (c) Pallet modeling, materials and stacking configuration are tunable and (d) Environment (in this example, only ground is modelled, walls and roof are assigned to absorbing conditions, representing a portal in a large space).
The portal is made in metal. Its role is twofold: to support the three sliding antenna systems and to define the volume where pallet and tags are placed to be read. The pallet settings (materials, dimensions, etc.) can be defined arbitrarily. The near-field environment can be composed of ground, walls, roof, or any other object that could impact EM field propagation in UFH band. Real electrical properties are assigned to all constitutive materials, including, ground, roof or walls.
The entire system has been modeled using the Finite Integration Technique (FIT) solver available in CST microwave Studio software [10]. More than 50 million of FIT cells are needed to model the entire system. Graphic Processor Unit (GPU) cards are used to lower the computation time.
Impact of antenna diversity in a UHF RFID portal case: preliminary results
The main objective is to quantify the electromagnetic field coverage within the portal volume since reading performance is directly proportional to the field intensity. Link to budget explanations.
Intensive numerical simulations have shown that a suitable FIT mesh size is 10mm, about l/35. The amplitudes of the three electric field components are extracted with a discretization step equal to Δx=Δy=Δz=30mm. This represents 16.000 observation points uniformly distributed within the pallet volume (1.2 x 0.6 x 0.6 m3). The data are post-processed to determine the number and locations of observation points where the field intensity is below an arbitrary threshold value for each field component. In parallel, detailed studies of power budgets if real RFID systems have shown that a threshold equal to 1V/m is a realist field value to power-on the tags. To compare fairly scenarios with a different number of antenna elements, the total EIRP must be kept identical.
Several scenarios with increased complexity have been explored and will not be reported here for the sake of brevity. Only one example is described here (Fig. 12). The room dimensions are 6 × 4 × 2.7 m3. Ground has been assigned as concrete (εr= 7.7, σ = 1 S/m) and the other walls are open boundary conditions. The metallic portal dimensions are the following: L = 2.4 m, l = 1.11 m and h = 2.5 m. Three antennas are placed on the portal, one on the top, and the other two on both side. Four motorized linear railways are used, the first one allows moving the pallet, and the other three enable to move the antennas. Four layers of nine boxes whose dimensions are 192 × 192 × 300mm3 and separated with an interspace of 6mm, are placed upon the pallet (Fig. 4). The volume under test (pallet with tagged objects) includes or not several metallic slabs, as shown in Fig. 12. Various sub-scenarios depending on the number and positions of metallic slabs have been studied (Fig. 13).
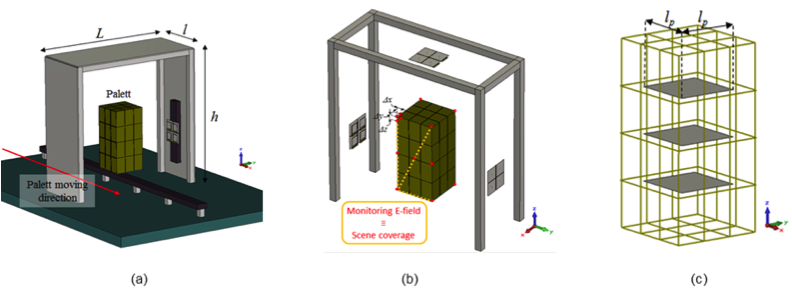
Fig. 12. Example of testing scenario: (a) Geometry of the modelled RFID portal and pallet. (b) Observation grid with E-field probe locations (16000 in total). (c) Pertubating metallic plates (400x400mm2) inside observed volume (right)

Fig. 13. Different scenarios with or without metallic slabs
The field coverage is extracted from EM calculation and post processed with Matlab [11]. Field distributions computed for Scenario C are represented in Fig. 14 (left) for two different antenna configurations (the excited radiating element is either antenna#1 or antenna#3). The effect of internal reflections inside the volume under test is clearly visible. Fig. 14 (right) shows in blue the observation points below metallic plate 1 where the electric field value is below the threshold (1V/m). This graph represents non covered points for Ex components defined as points with |Ex|< |Ethreshold| (in V/m). Fig. 14 (left) also shows that different filed distributions are obtained within the portal depending on the antenna location (or radiation pattern shape).
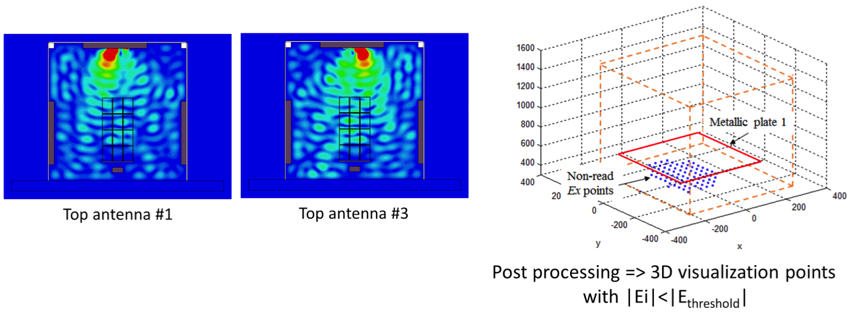
Fig. 14. Field map simulation results, and observation points where the electric filed magnitude is under threshold
Statistical post-processing of all scenarios allows defining the impact of antenna diversity upon radio coverage (uniformity and field intensity) of the portal volume. This enables to determine the number of tags that can be read under antenna diversity illumination. Fig. 15 shows an example of results by considering only the Ex field component. This graph illustrates the radio coverage improvement provided by diversity antenna.
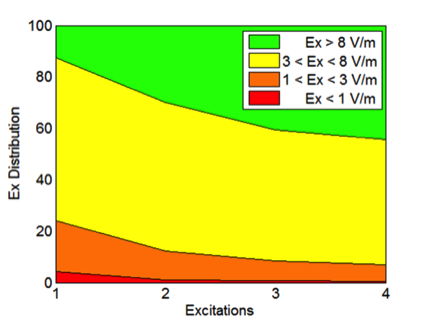
Fig. 15. Field simulation results: percentage of read tags versus the diversity configuration
umerical values of read tags shown in Fig. 15 are given in the table below (Fig. 16). The percentage value extracted from numerical simulations is calculated over 16 000 points or probes with|Ex|>|Ethreshold|. If we consider a 8V/m threshold level in Fig. 16, configuration Ant.#1 & #2 increases the percentage of read tags up to 30% compared to 12% with only one antenna (Ant.#1).
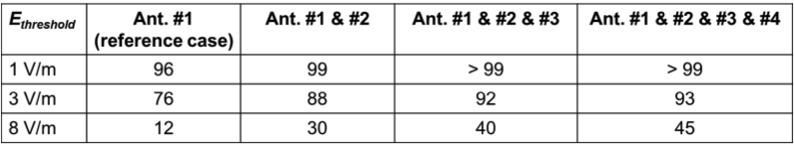
Fig. 16. Percentage of read tags for different configurations
The rate of non-read tags is provided in Fig. 17 for two different threshold values (1V/m and 3 V/m), three different scenes (Scenarios A, B or C, Fig. 13) and two different reader antenna systems (single antenna where only one of the four patches is excited, or antenna with diversity (as defined in Fig. 16).
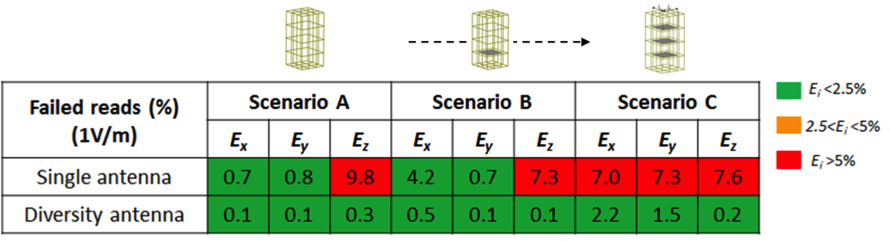
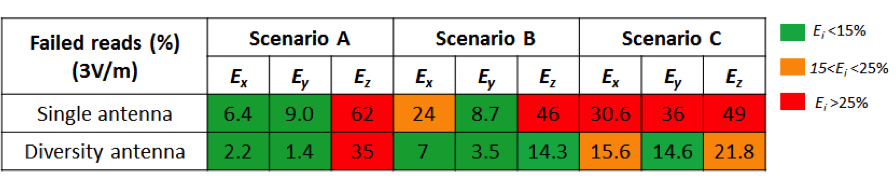
Fig. 17. Comparison of non-read tag rates between single antenna and diversity antenna following the complexity of scenario.
In Fig.17a, failed reads stays below 2% for 1V/m threshold with diversity antenna (7% for the reference case), while it is around 15% for 3V/m threshold with diversity antenna (> 30% for the reference case) (Fig.17b). Unread locations percentage remains very low even in harsh conditions with antenna diversity.
3. Logical tag coupling for reliable RFID inventory
Current RFID systems are not utterly reliable as they may fail to read all the tags present in their RF field of view, particularly when dealing with bulk tag reading in pervasive environments. To enable reliable tag inventories in such conditions, we put forward the concept of RFID tag grouping, i.e., logically coupling tags thus forming a consistent group. Tag grouping allows to identify missing tags by reading only a subset of the group, with no need to external information systems.

Fig 18. Tag coupling concept
In the context of the pervasive RFID project, we introduce EraRFID, an erasure coding approach for RFID tag grouping. EraRFID models RFID tag inventorying as an erasure coding problem, and solves this problem using the well-known Reed Solomon (RS) codes.
EraRFID overview
The main idea of EraRFID is to abstract RFID tags as data carriers (i.e., data storage nodes), thus transforming the problem of reliable RFID tag reading into a data recovery problem, as in the context of data transmission/storage systems. Accordingly, the tag reading failures brought about by RFID systems are assimilated to data erasures that can be addressed using erasure coding techniques. To meet this goal, EraRFID uses specific erasure codes (viz., the well-known Reed-Solomon (RS) codes) to deal with the loss of tag identifiers (considered as a particular kind of RFID data). Specifically, it proceeds through two main phases:
1) RFID tag programming consists in acquiring all tag identifiers of a RFID tag batch, then encoding these identifiers using a RS coding scheme, while minimising the storage overhead. Object identifiers are usually generated and programmed during the early manufacturing process of RFID tags. To comply with such a fact, EraRFID considers object identifiers (e.g., standard Electronic Product Codes (EPCs)) already stored in tags. The data resulting from the encoding process is further stored within RFID tags in a way that allows recovering the input identifiers when inventorying the tag batch.
2) RFID tag reading takes place when a separate RFID system inventories the considered tag batch. This phase consists in: (i) acquiring some subset of the data stored within tags (by reading only a subset of tags), (ii) decoding the acquired data to obtain all tag identifiers (i.e., initially encoded in the previous step), then (iii) compare the decoded tag identifiers to the inventoried ones in order to deduce missing tags.
Experimental settings
We conducted a set of experiments to assess the efficiency of EraRFID in terms of timeliness and storage overhead. Our experiments mainly concern both phases of EraRFID (i.e., tag programming and reading phases). That is, we do not write and read data in/from RFID tags, we rather simulate these operations to avoid the problems entailed by programming tag batches of important size. More specifically, we proceed through of three steps:
- We consider a given number of 96-bit EPCs and we encode them with respect to the tag programming phase, then we store the obtained result into a data structure (instead of RFID tags);
- We cause erasures by removing the data corresponding to a number of RFID tags from the data structure;
- We pass the remaining data to the decoding phase, thus obtaining the EPCs of the erased tags.
Storage overhead
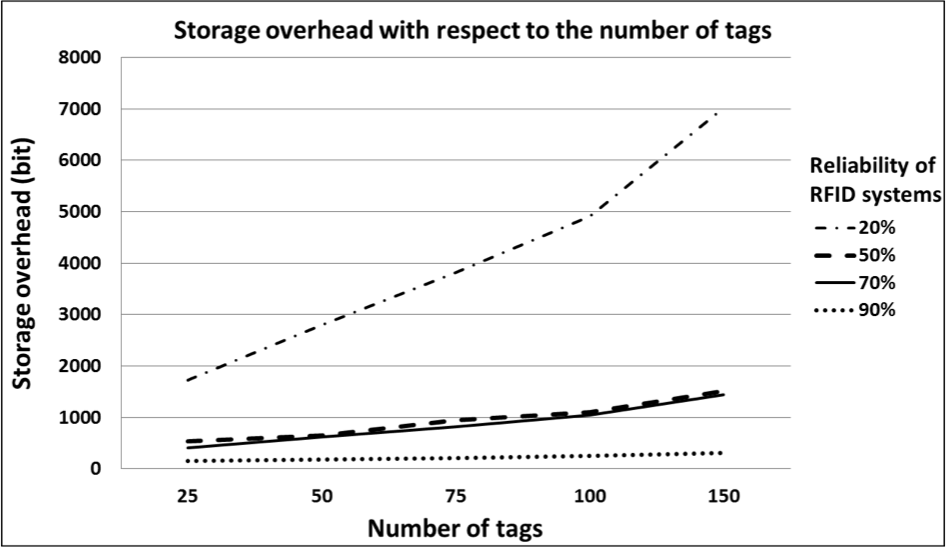
Fig. 19. Storage overhead with respect to the number of tags
Figures 19 and 20 depict the storage overhead produced by EraRFID with respect to the number of tags and the reliability of RFID systems, respectively. We vary the number of tags between 25 and 150, and the reliability of RFID systems between 20% and 90%. Figure 19 shows that the produced storage overhead increases almost linearly along with the number of tags. For instance, for 100 tags (each having an ID of 96 bit) and a reliability of 50%, the storage overhead reaches 1 Kbit, however for 25 tags, it decreases to 528 bit. However, Figure 20 shows that the storage overhead increases almost exponentially disproportionately to the reliability of RFID systems. For instance, for 100 tags (each having an ID of 96 bit) and a reliability of 50%, the storage overhead reaches 1 Kbit, and it considerably decreases to 256 bit when the reliability is of 90%. The obtained results mean that EraRFID is more efficient for RFID systems with important reliability, and it is suitable for tag batches with various sizes (under the constraint of the tag memory size).
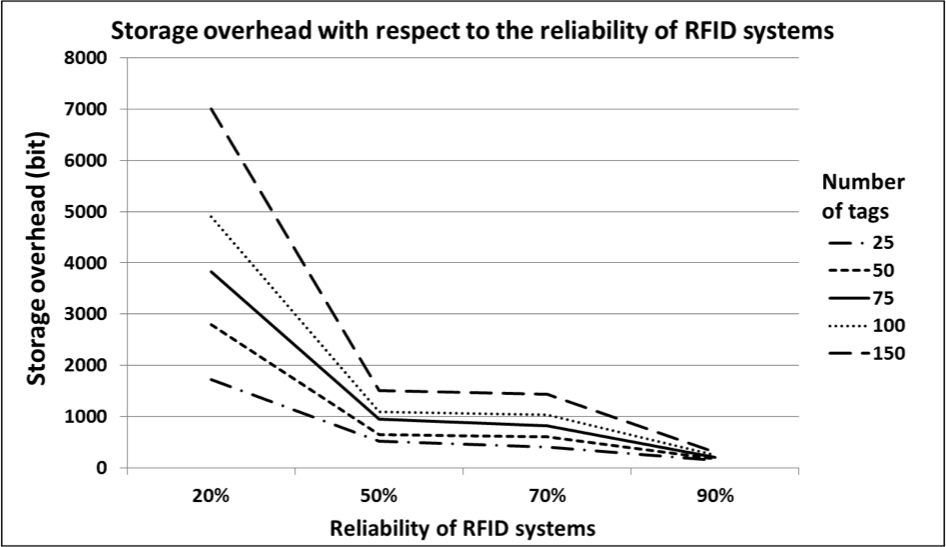
Fig. 20. Storage overhead with respect to the reliability of RFID systems
Timeliness
Figures 21 and 22 depict its execution time of EraRFID with respect to the number of tags and the reliability of RFID systems, respectively. We vary the number of tags between 25 and 150, and the reliability of RFID systems between 20% and 90%. Both figures show that the execution time of EraRFID increases along with the number of tags and disproportionately to the reliability of RFID systems, which is an expected result. Based on these figures, we deem that EraRFID executes in a timely manner compared to the time needed by networking infrastructures to determine missing tags. For reliable RFID systems (e.g., reliability of 90% and 70%), EraRFID determines missing tags (in a group of 100 tags) in less than 1 second. Whereas, for unreliable systems (e.g., reliability of 20%), EraRFID is able to determine the identifiers of up to 90 missing tags (out of 100) in less than 4 seconds, which can be considered as a satisfactory result given the number of missing tags. Additionally, it worth reminding that this execution time comprehends both the tag programming and reading phases.
Overall, EraRFID shows satisfactory timeliness and storage overhead, notably for RFID systems with an important reliability.

Fig. 21. Execution time of EraRFID with respect to the number of tags

Fig. 22. Execution time of EraRFID with respect to the reliability of RFID systems
Perspectives
In addition to spatial diversity, the proposed antenna system geometry enables one to achieve pattern and polarization diversity. Indeed, by combining two elements of the proposed array, directive beams or tilted beams can be easily achievable. Polarization diversity is straightforward if the radiating elements radiate different polarizations. In our case, polarization diversity can be achieved with a two element combination. For example in Fig. 4b, considering element ‘1’ right-handed circularly polarized (RHCP) and element ‘2’ left-handed circularly polarized (LHCP), the combination of them will result in a linearly-polarized far field.
An active beam forming network (BFN) is now under investigation. The latter uses basic components as on PIN diode or RF switches. Future works could consider more complex BFN to increase the rate of read tags, provided this fits with industrial needs (under study).
We have also seen that radiation pattern diversity plays an important role to reduce non-read tags. In order to enhance pattern diversity, an antenna system with 4 helix mounted on a bended ground plane could be considered (0a). Outer dimensions are 460 x 460 x 160mm. In free space, radiation patterns are well defined and cover a wide field of view. Nevertheless, the impact of portal environment is significant (Fig. 19b), and further optimizations are needed.
Beside RF aspects, short term and long term perspectives are still to be investigated towards a valuable tag coupling solution.
Short term perspectives mainly concern extensive experimental studies performed using the RFID testbed. These studies aim at assessing the performance of EraRFID with respect to different use cases and application domains. Additionally, we aim at evaluating the performance of EraRFID combined to the novel versatile antennas introduced by IETR.
Long term perspectives are about investigating further methods for tag coupling such as introducing logical structures (e.g., planar and hierarchical structures) that connect tags together. Such structures can be implemented by assigning specific values to tags’ identifiers, thus forming ‘follow-up’ links among tags. Accordingly, when reading a subset of tags, the remaining part of the structure can be deduced. For instance, a pallet of RFID tags can be modelled using hierarchical structures, e.g., a tree structure. A prominent idea to fulfill such a structure is to use prime numbers as tag identifiers.
References
[1] K. Finkenzeller, “RFID Handbook: Fundamentals and applications in contactless smart cards, radio frequency identification and near-field communication”, Wiley, 2010.
[2] D. Paret, “RFID at Ultra and Super High Frequencies: Theory and application”, Wiley, 2009.
[3] W. He, Y. Huang, Z. Wang, and Y. Zhao, “A circular polarization MIMO antenna system applied for RFID management,” 8th Int. Symp. Antennas, Propagation and EM Theory, ISAPE 2008, pp. 225-228, 2-5 Nov. 2008.
[4] H. W. Son, H. Park, K. H. Lee, G. J. Jin, and M. K. Oh, “UHF RFID reader antenna with a wide beamwidth and high return loss,” IEEE Trans. Antennas Propag., vol. 60, no. 10, pp. 4928-4932, Oct. 2012.
[5] X. Chen; G. Fu, S. X. Gong, Y. L. Yan, and W. Zhao, “Circularly Polarized stacked annular-ring microstrip antenna with integrated feeding network for UHF RFID readers,” IEEE Antennas and Wireless Propag. Letters, vol.9, pp. 542-545, 2010.
[6] P. Charoenchue, C. Phongcharoenpanich, K. Phaebua, and K. Aunchaleevarapan, “A circularly polarized square plate antenna with two inclined slots for UHF-RFID reader,” Int. Symp. Intelligent Signal Processing and Communications Systems (ISPACS), 7-9 Dec. 2011.
[7] D. Z. Kim, H. S. Tae, K. S. Oh, M. Q. Lee, and J. W. Yu, “Helical reflector antenna with a wideband CP for RFID reader,” Asia Pacific Microwave Conference 2009, APMC 2009, pp. 1032-1035, 7-10 Dec. 2009.
[8] S. Pflaum, P. Le Thuc, G. Kossiavas, and R. Staraj, “Circularly polarized patch antenna using UC-PBG structure for RFID readers,” 7th European Conference on Antennas and Propagation (EuCAP), pp. 2083-2086, 8-12 Apr. 2013.
[9] 42 ETSI 302-208-x “Electromagnetic compatibility and radio spectrum matters (ERM); Radio frequency identification equipment operating in the band 865 MHz to 868 MHz with power levels up to 2 W,” www.etsi.org
[10] https://www.cst.com/
[11] http://www.mathworks.fr/products/matlab/
[12] H. Steyskal, “Digital beamforming antennas: An introduction,” Microwave J., vol. 30, no. 1, pp. 107–124, Jan. 1987.
[13] N.C. Karmakar, “Handbook of Smart Antennas for RFID Systems”, Wiley 2010.