Warning!
PrerequisiteFor this tutorial we assume that you have a opened a model and a property. If you don’t know how to do that please refer to step 1.
The simulation panel allows to generate one trace step-by-step, and to look at the values of the model’s variables and the properties along this trace. It is made of four different areas which are:
- A data selection panel
- A simulation control panel
- A properties panel
- A simulation result panel

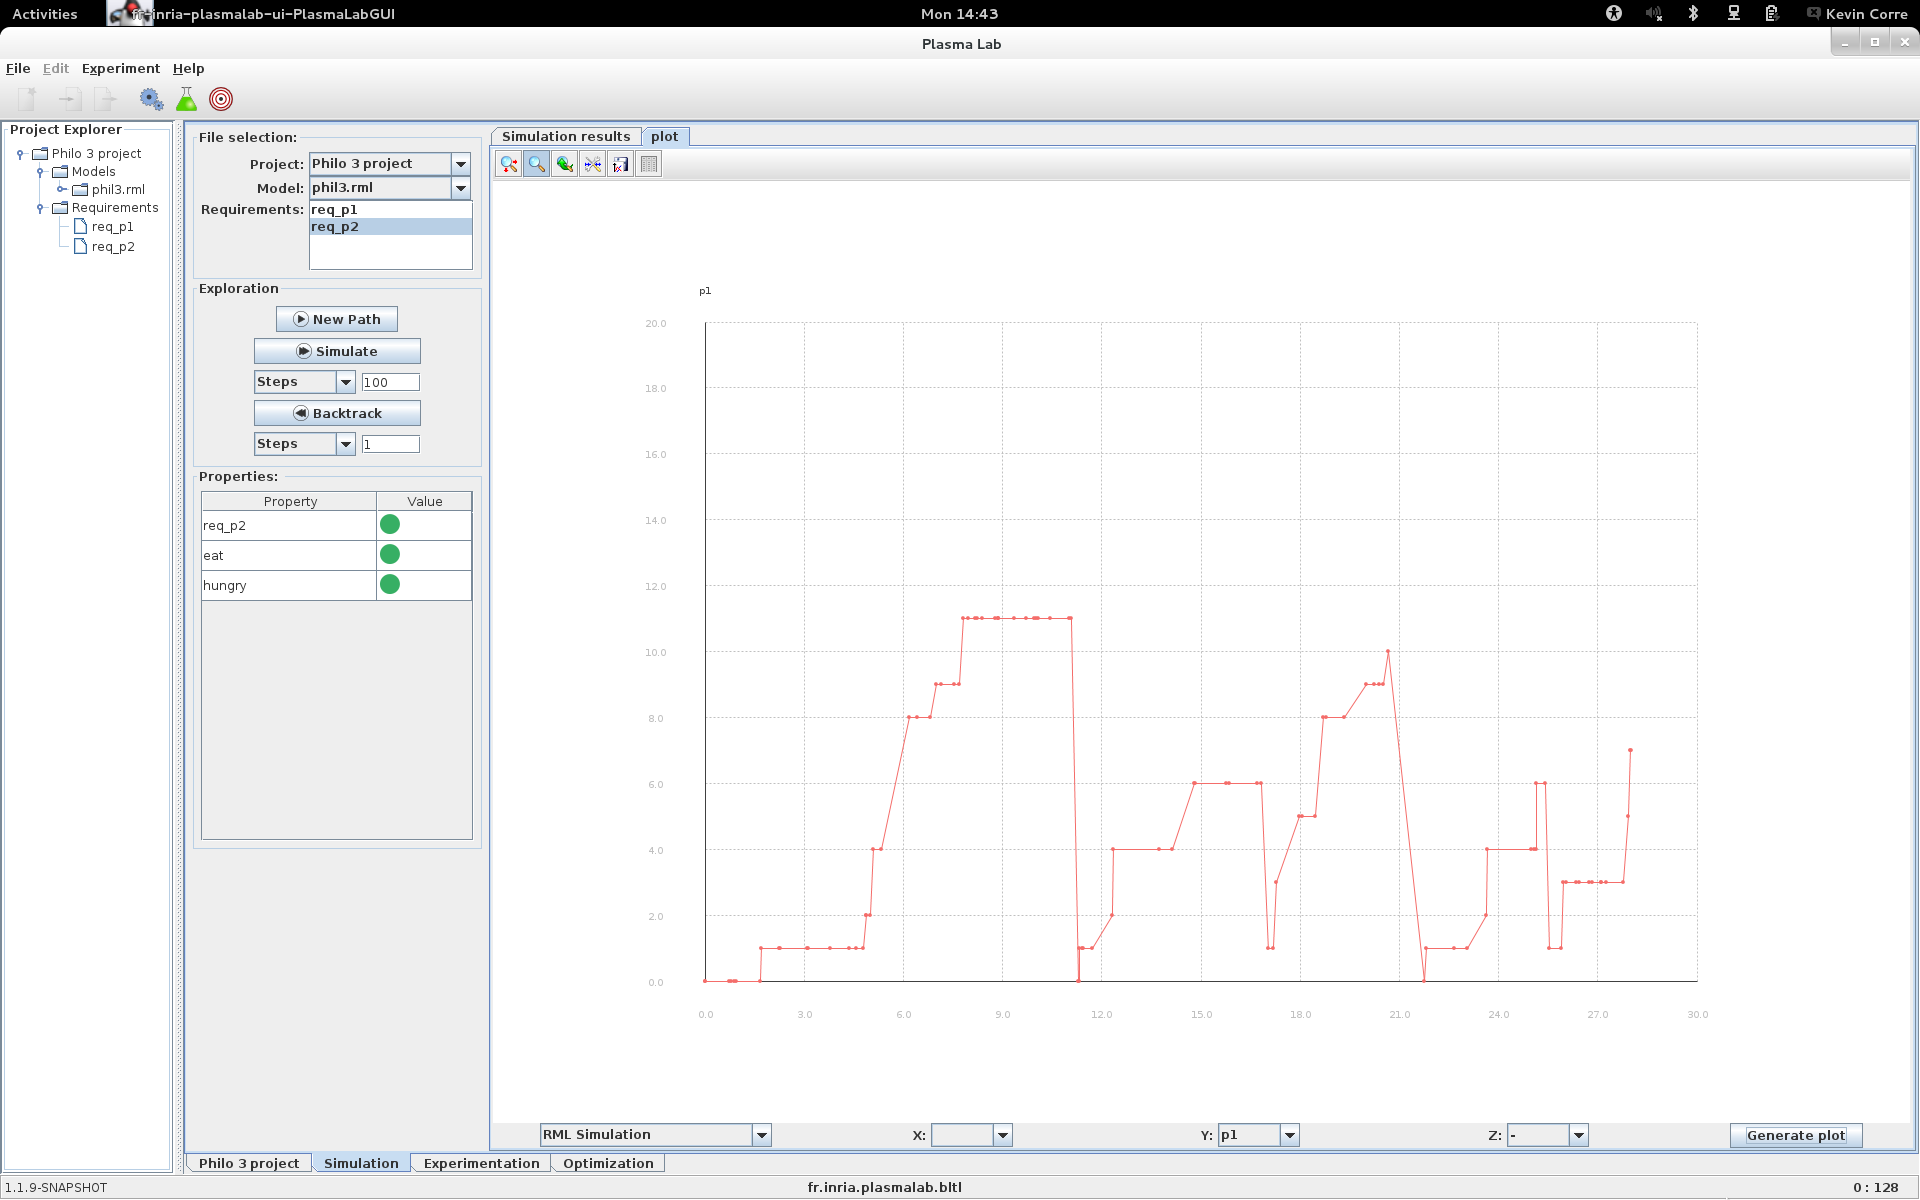
Simulation panel
In order to simulate our model we select the project and the model from the data selection panel. We can also select properties to check during the simulation but this is not mandatory.
To start a new trace we use the new path button in the simulation control panel. The initial state of our model appears in the simulation result panel. We can then simulate the model for one or several steps or backtrack the simulation using the corresponding button.
When the simulation progress or when we select a specific state, values are updated in the property panel such that it displays the result of checking the properties on the trace up to the selected state.
Alternatively to the simulation result panel, we can use the plot panel. This panel allow us to draw 2D or 3D plot. To draw a 2D plot showing the evolution of p1 against time select the blank value in the X combo box (the empty identifier represents the time in our rml simulator) and p1 in the Y combo box.