This example study the propagation of a virus in a network that comprises three sets of linked nodes: a set of nodes containing one infected by a virus, a set of nodes with no infected nodes and a set of barrier nodes which divides the first two sets. A virus chooses which node to infect nondeterministically. A node detects a virus probalistically and we vary this probability as a parameter for barrier nodes. we consider time as a second parameter.
This example is also presented here, and a PLASMA Lab project file that contains the example can be downloaded here.
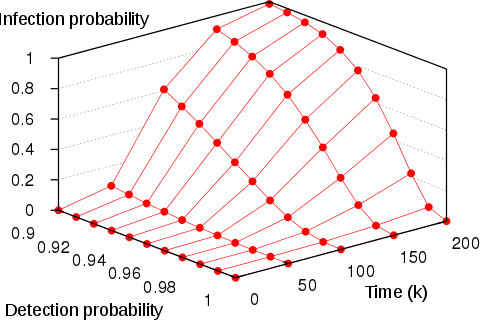
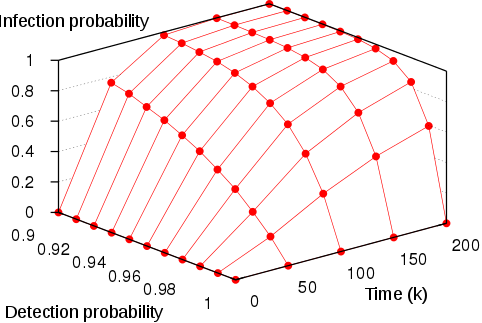
We use the smart estimating algorithm to estimate the probability that the virus spread from a single node in the grid to the farthest corner of the network within a limited time. For the analysis we use a budget of 100’000 simulations and parameters delta and epsilon equal to 0.01. We plot in the left figures below the minimum and maximum estimated probabilities for different values of the detection probability, and different values of time. We also display on the right the estimation errors, which are within the precision epsilon of 0.01.
 |
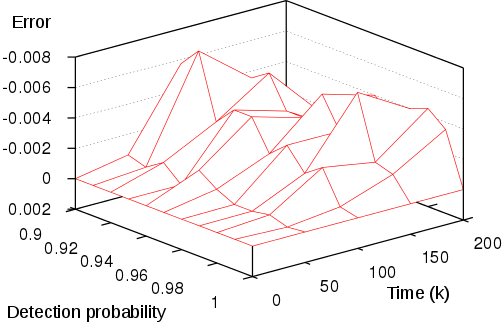 |
| Minimum probability | Error in minimum probability |
 |
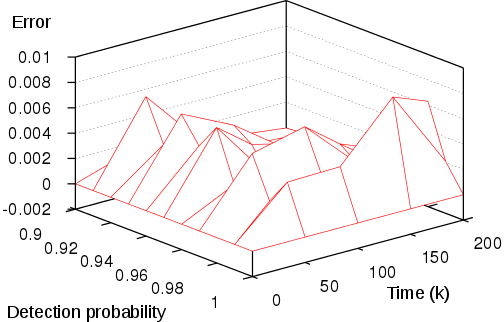 |
| Maximum probability | Error in maximum probability |
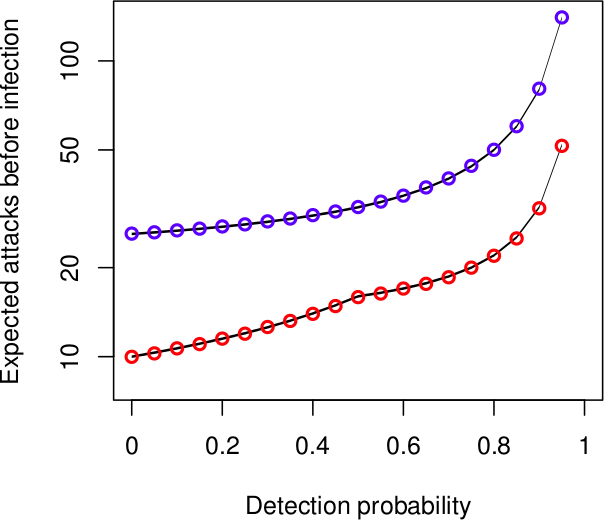
We also compute the minimum and maximum number of attacks until the end node is infected. We plot the results below, for several values of the detection probability. The blue dots correspond to the maximum value while the red dots correspond to the minimum. The black lines depict the exact values according to Prism model checker.
 |
| Minimum and maximum number of attacks |