Simulink model
Important!
Our model can be downloaded here:- Plasma project: PigsShed.plasma
- Simulink models:
- Base model: cochons.slx
- Model without failures: cochons_nofail.slx
- Optimized model (without scopes): cochons_optim.slx
To execute the model you will need to build the S-Function Builder in Simulink:
- Right click on S-Function Builder block and select “Properties”
- Launch “Build”
The system under control is a pig shed equipped with a fan and a heater to regulate the air temperature. Air temperature in the shed is subjected to random variations due to the variation of external temperature and the variation of the number of pigs that produce heat. The objective of the controller is to counter these variations such that the temperature remains within a given comfort zone. To do so, the controller can activate the heater to increase the temperature, and the fan to bring external air and therefore cool the shed. Then the temperature T of the shed is given by the following differential equation:
\(\displaystyle T’=T_{ext}*Q – T*Q + W_{heater} + W_{pigs} \)
where \( T_{ext}\) is the external temperature, \( Q=Q_{min}+Q_{fan} \) is the air flow created by a minimal flow \( Q_{min} \), and an additional flow \( Q_{fan} \) when the fan is activated, \( W_{heater} \) is the heat produced by the heater, when activated, and \( W_{pigs} \) is the heat produced by the pigs. This equation is modeled by the following Simulink subsystem:
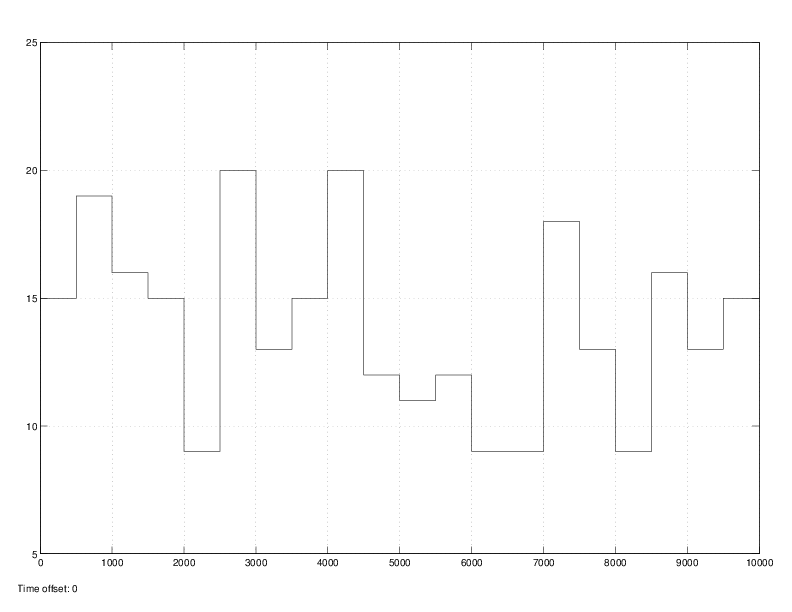
The number of pigs is determined every 500 time units according to a Poisson law with \( \lambda=13 \). The external temperature is modulated by two sinusoidal between \(-1{}^oC \) and \(+25{}^oC \), with periods 628 t.u and 62.8 t.u.
The controller that we study applies a bang-bang strategy that is specified by four threshold:
- When the temperature goes above \( \sf TFanOn \), the fan is turned on.
- When the temperature returns below \(\sf TFanOff \), the fan is turned off.
- When the temperature goes below \(\sf THeaterOn \), the heater is turned on.
- When the temperature returns above \( \sf THeaterOff \), the heater is turned off.
This controller is implemented by the following Stateflow automata:
The fan and the heater are subjected to random failures when they are in used. Exponential distributions control the occurrence time of a failure. After a failure a reparation process allows to restart the fan or the heater, but it also takes a random time, exponentially distributed. These failures are modelled by two Stateflow automata:
In this automaton, \(\sf rnd\) is a random number between 0 and 1, and \(\sf tuse\) is the duration of use of the fan or heater. The timings \(\sf tfail\) and \(\sf trepair\) corresponds respectively to the time of next failure, and the repaire time, each chosen according to an exponantial distribution with parameter \(\sf lambdaFail\) and \(\sf lambdaRepair\), respectively.
Verification
The controller objective is to maintain the temperature within a comfort zone specified by a minimum and a maximun temperature (resp. \({\sf T_{min}}=15{}^oC\) and \({\sf T_{max}}=25{}^oC\)). In this section we consider the following values for the controller thresholds: \({\sf TFanOn}=22{}^oC\), \({\sf TFanOff}=20{}^oC\), \({\sf THeaterOn}=18{}^oC\) and \({\sf THeaterOff}=20{}^oC\).We apply statistical model-checking to evaluate the efficiency of the controller both in the presence and absence of failures.
The first BLTL property that we monitor checks that the system is not in discomfort for an excessive period of time. This is expressed by the following property:
\( \displaystyle \Phi_1 = \neg(F_{\leq t_1} G_{\leq t_2} {\sf Discomfort})\)
where \(t_1\) is the simulation time, \(t_2\) is the accepted discomfort time, and \({\sf Discomfort}\) is a predicate that is true when the temperature of the system is outside the comfort zone.
A second BLTL property checks that each period of discomfort is followed by a period without discomfort:
\( \displaystyle\Phi_2 = G_{\leq t_1}\Big( G_{\leq t_2} {\sf Discomfort} \Rightarrow F_{<= t_3} ( G_{\leq t_4} \neg {\sf Discomfort}) \Big)\)
Here \(t_1\) and \(t_2\) are as previously, while \(t_3 \geq t_2\) is the expected time at which the system returns to normal situation and \(t_4\) is the duration of the period without discomfort.
We use PlasmaLab statistical model-checker to estimate the probability to satisfy these properties for different values of the timing constraints. Each property is evaluated over a period of time \(t_1 = 10000 t.u.\) with 100 simulations. \(\Phi_1\) is evaluated for several values of \(t_1\) and \(\Phi_2\) is evaluated with \(t_2=100 t.u.\) and \(t_3=200 t.u.\) and several values of \(t_4\).
| Without failure | With failures | ||
| \(\Phi_1\) | \(t_2=100\) \(t_2=200\) \(t_2=300\) |
0.87 0.99 1.0 |
0.01 0.23 0.78 |
| \(\Phi_2\) | \(t_4=300\) \(t_4=500\) |
0.95 0.9 |
0.57 0.08 |
Optimisation
We want to optimise the performances of the system such that it minimizes the discomfort and the energy cost spent in heating and cooling. To achieve this we can manipulates the 4 temperature thresholds of the controller. Each threshold is therefore assigned to a range of values. The product of these values gives a set of initial conditions to analyse the system. PlasmaLab can evaluate the values of the cost and the discomfort for each of these values. We can then select the best values of the parameters according to the pareto curve:


