
3D tissue complication probability (NTCP) models
Medical context
The prostate is a gland in the male reproductive system. The prostate is located below the bladder and in front of the rectum (see Figure 1). Radiotherapy is one of the standard treatment of localized prostate cancer. The main challenge in Prostate Cancer RadioTherapy (PCRT) is to deliver the prescribed dose to the clinical target (prostate and seminal vesicles) while minimizing the dose to the Organs At Risk (OAR) of toxicity -related events. Intensity Modulated RadioTherapy (IMRT) [1] is the reference conformal radiotherapy technique which has improved the dose delivery reaching complex tumor shapes. However, the underlying toxicity dose-volume-effect relationships are still to be unraveled in order to adapt specifically the treatment to each patient and therefore decrease toxicity [2]. Several issues are still to be tackled especially regarding the customization of the treatment by introducing individual specificities with the goal of improving local tumor control and decreasing toxicity.

Figure 1. Illustration of the anatomy of the male reproductive tract (newhealthguide.org)
Rectal bleeding is one of the most important sequelae after prostate cancer radiotherapy and impacts the patient’s quality of life [3]. The potential secondary effects due to the delivered dose to the OAR are far from being completely explained [4]. Therefore, unraveling the underlying local dose–volume effect toxicity relationships and identifying patients at higher risk, appears as a cornerstone in further definitions of constraints for personalized IMRT planning.
Imaging plays an important role in the noninvasive detection, localization, grading, and staging of prostate carcinoma and in carrying out biopsies for histopathologic analysis of the tumor.
State of the Art
RT inverse planning implies specifying dose-volume constraints standardly calculated in the whole organs at risk of toxicity [5-7]. Toxicity models, also potentially used to guide the planning, are based on dose-volume histograms (DVH) [8-9]. Several normal tissue complication probability (NTCP) models have been proposed to assess the risk of toxicity according to the dose. One of the most used NTCP models was proposed by Lyman in the context of uniform radiation therapy [10]. The DVH is first reduced to a single representative measure as for example equivalent uniform dose [11], and is therefore converted into a probability of complication by a mathematical model depending on parameters estimated from empirical data [12].
The difficulty in improving toxicity prediction is the combination of dose parameters and non-dosimetric parameters (clinical history, tumor characteristics or combined treatment) within the predictive models. Some authors proposed, to solve the problem, to stratify the population and then estimate the model parameters at each stratum or to add extra parameters to classic NTCP models [13-14], but at the expense of statistical power. Thus, each subgroup does not always meet the necessary number of patients to estimate the model parameters and the estimation procedure becomes more unreliable. Other recent approaches proposed to predict late toxicity using principal component-analysis (PCA) [15], a new approach based on random forest (RF) [16] and functional principal component analysis (fPCA) [17].
Most of the proposed models have been solely based on the dose–volume histograms (DVH) thereby loosing spatial information. These methods do not perform a formal classification exploiting the spatial characteristics of the dose distributions since they considered the organs as having homogeneous radio-sensitivity. Buettner et al. [18-19] addressed the issue of spatial information loss. In [18], a classification approach based on locally connected neural network using a two-dimensional dose-surface maps was performed. In [19], they proposed a parameterized representation of the dose to describe its geometrical properties, such as the eccentricity, and its lateral and longitudinal extent which still remains approximative in terms of spatial location. New methods aimed at jointly taking advantage of the Three-Dimensional (3D) dose distributions, unraveling the subtle correlation between local dose and toxicity at a voxel level to classify patients at risk, are still to be devised.
Performing classification by simultaneously exploiting the 3D signal across a population is challenging because the inter-individual anatomical variability leading to a misalignment of information. To cope with this issue, non-rigid registration methods have been employed in order to map all the data to a common coordinate system where voxel analysis may be meaningful in terms of spatial localization [20]. Following this idea, previous classification approaches exploiting the 3D signal across a given population have been proposed. For instance, Principal Component Analysis (PCA) was used by Fripp et al. [21] to discriminate Alzheimer’s disease and normal elderly control participants based on non-rigidly registered 3D Positron Emission Tomography (PET) images. With the same objective, Higdon et al. [22] performed a comparison of different classification methods (logistic regression, Linear Discriminant Analysis (LDA) and quadratic discriminant analysis) which were used after a data reduction algorithm (PCA and Partial Least-Squares (PLS)) using FDG-PET images. A leave-one-out cross validation showed that better results could be obtained when PLS and LDA are used for data reduction and classification, respectively. Nevertheless, it appears that methods based on PLS slightly outperform PCA-based methods on diagnostic accuracy.
Models based on patient parameters, dosimetry parameters and dose-volume histograms
Purpose
Our first objective is to propose a new variable computed with independent component analysis to predict late rectal toxicity following prostate cancer radiotherapy and to compare its performance to classic models (logistic regression).
Material
Records from 216 patients who received definitive radiotherapy for localized prostate adenocarcinoma were analysed. Data was prospectively collected. Ethics committee approval was obtained and all prospective patients were given informed consent according to the current revision of the Helsinki Declaration. All patients had a biopsy proven prostate adenocarcinoma. Pretreatment workup included a CT scan and a bone scan. Mean age was 67.84 years (ranging from 52.07 to 81.98 years). Prior abdominal surgery was reported in 16.20% of the patients, anticoagulant treatment in 16.67% and diabetes in 6.02%. The T stages according to the 1992 American Joint Committee on Cancer Staging System [23] were T1 in 21.30% of the patients, T2 in 65.28% and T3 in 12.5%. The mean prescribed dose to the prostate was 75.49 Gy (from 62 to 80 Gy) at 2 Gy per fraction, the seminal vesicles receiving 46 Gy. All the patients received 3D conformational RT. The 3D radiation technique was carried out following the French GETUG group recommendations [3]. Patients underwent simulation and treatment in the supine position. Target volume and organs at risk (bladder, rectum and femoral heads) were delineated on CT slices. The rectal DVH had to respect GETUG recommendations [24], being a V72 < 25% and a maximum dose (within 1.8 cc) < 76 Gy. All patients were evaluated every three months in the first year and every six months thereafter. Late rectal toxicity was defined as events occurring more than six months after the beginning of RT. To determine the severity and incidence of late rectal toxicity, records were prospectively extracted from standardized questionnaires taken at each follow-up visit. Rectal toxicity was classified according to the SOMA/LENT morbidity scoring system. Patients with a history of hemorrhoids were not scored as grade 1 bleeding. Analyses were performed for rectal bleeding (grade≥ 2). For estimating the models only patients with a follow-up longer than three years were selected.
Method
1. A new independent component analysis parameter (pICA) for NTCP modelling
This section presents the statistical analysis used to estimate the new proposed variables (pICA). We aim at characterizing patients presenting or not rectal bleeding by extracting from the DVH of both groups the more informative subspaces. Thus, according to this selection, we compute our new pICA parameter by measuring the distance of a new individual’s DVH to both subspaces and computing a ratio. The database was randomly split into a training and a validation cohort. ICA was applied on the training cohort using the rectal DVH bins. Thus, we estimated the pICA for each patient and added it in a standard logistic regression. The resulting ICA models were tested on the validation cohort.
2. Logistic regression to identify significant parameters and estimate the risk of rectal toxicity
Standard logistic regression was used to estimate the risk of toxicity, including statistically-significant parameters found in multivariate analysis [25]. The following parameters were tested in uni and multivariate analysis as potentially impacting on the risk of toxicity: patient characteristics (age, history of abdominal surgery, diabetes and anticoagulant treatment, gleason, PSA), radiation therapy characteristics (hormonal therapy, IMRT, IGRT, total of dose), tumour characteristics (T stage and D’Amico stage), DVH bins and new variables computed using ICA (pICA), PCA (PC) [15], RF [16] and FPCA (fPC) [17].
3. Assessment and comparison of the predicted capabilities of the different models
In order to assess the predictive capabilities of all the different models (LKB, LR, PCA, RF, FPCA and ICA NTCP models), the area under the curve (AUC) was used as a measure of the performance. Once the model has been trained for a specific toxicity endpoint, this model can be used to predict the NTCP for a new patient. The database was randomly split into a training cohort (65% of patients) and a validation cohort (35% of patients). For a thorough evaluation, we repeated the cross-validation scheme 100 times in order to assert the stability of the proposed approaches.
Results
In this study, we focused on 3-year Grade≥ 2 rectal bleeding endpoint. For this toxicity endpoint, 216 patients had a follow-up longer than 36 months, with 18 toxicity events. Figure 2 shows the mean AUC of the different models used to predict 3-years Grade≥ 2 rectal bleeding with dose parameters, using a cross-validation scheme repeated 100 times. Our approach obtained a mean AUC of 0.70 when using a multivariate model on the following distance-based parameters, p ICA , for each patient. The best results were obtained when the first seven features were exploited (n = 7). Indeed, the performance drops down in terms of AUC when using more than seven features. These results are superior to those obtained with comparative models using firstly only the DVH, which were 0.53 and 0.62 for the LKB NTCP model and a standard logistic regression, respectively. Then, additional variables, that contribute to improve prediction in a standard logistic regression to estimate the risk of toxicity, were added to the logistic regression (namely history of abdominal surgery, diabetes) with our proposed distance-based parameters, p ICA (figure 2(b)). These variables were also added in a standard logistic regression with the significant bins of the DVH for comparison. The obtained mean AUC were 0.75 by adding significant clinical parameters using the seven first extracted features and 0.61 for the standard logistic regression. We also compared these results with the one obtained using the PCA approach based only on the DVH proposed by Sohn et al [15]. For this method, the correlation with toxicity of the first three principal components (PC) computed using DVH as single variables was investigated. According to this analysis, on our database, none of these first PC were significantly associated with rectal bleeding (p = 0.5255, p = 0.8374 and p = 0.1485, respectively). The obtained AUC for this approach were 0.53, 0.53 and 0.62 when using the three first PCs, respectively.
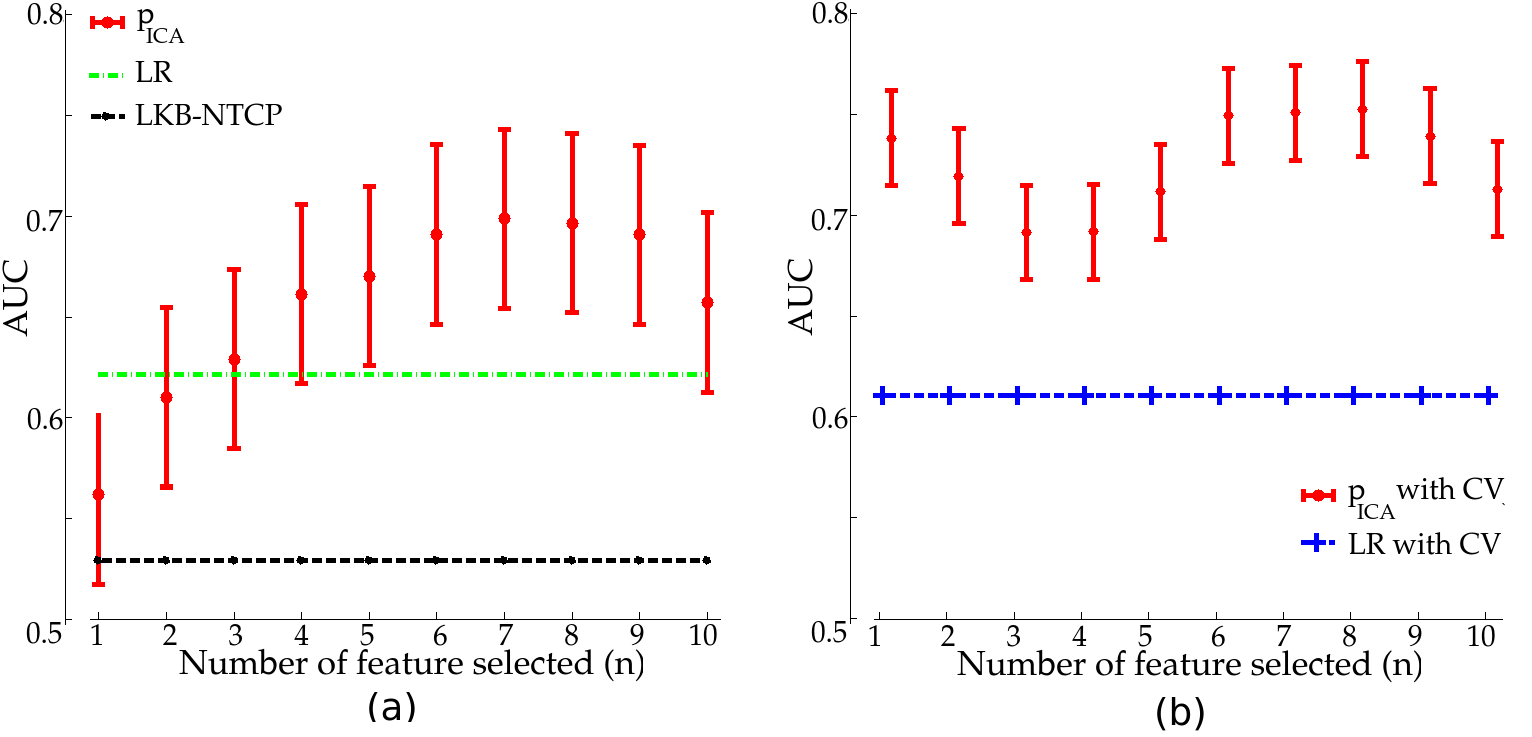
igure 2. AUC in predicting 3-year Grade≥2 rectal bleeding for LR, LKB-NTCP model and as a function of the number of exploited features (n) for the ICA parameters pICA (validation cohort only) using: (a) dose parameters and (b) dose parameters and clinical variables (CV)
This work was presented at the IEEE Engineering in Medicine and Biology Society (EMBS) conference, 2015. We are writing a paper about this work.
Discussions
Even if the obtained results are promising in terms of performance, they shall be confirmed with a statistical analysis based on a larger database and others toxicity endpoints, which will be the object of further research. Also, patients receiving the same treatment regimen have a sensitivity differences to ionizing radiation as quantified in [27]. This sensitivity need to be quantified in future approach to improve toxicity prediction. Moreover, our proposed parameters were computed using the dose-volume histograms for the whole rectum, thereby loosing spatial information. A recent study [26] has revealed associations between bowel quality of life and inferior rectal dose that could significantly influence radiation planning and prognostic models. For a thorough evaluation, future work will analyze the DVH of different rectal region in order to reveal associations between toxicity endpoints and rectal region that could significantly influence radiation planning and prognostic models. Identifying such spatial patterns is crucial if we aim at guiding the planning of dose distribution for patients, mainly at the inverse planning systems of IMRT. Our proposed new variable may be a useful new predictive variable to improve prediction of late rectal toxicity.
Conclusion
The aim of our work was to evaluate the predictive capabilities of a new parameters in predicting late rectal bleeding following prostate cancer radiotherapy. This study focused on the analysis of rectal DVH across a population. Representative features are extracted from the DVH using independent component analysis. Thus, a distance-based predictive parameter is derived by comparing two Euclidean distances. We also reconstructed the rectal DVH of all the patients using only the optimal features. The obtained results shed some light on the difficult problem of understanding dose-toxicity relationships. Thus, the ICA parameters emerges as a promising predictive variable for prediction in toxicity studies after prostate cancer radiotherapy. Future work will focuss on the possible differences between individuals explained by heterogeneity in radiation tolerance and will investigate the importance of radiosensitivity to predict toxicity endpoints in PCRT.
Models based on the 3D planned dose distributions
Objectives
Our second objective is to propose new methods able to predict late rectal bleeding following high-dose prostate cancer radiotherapy by fully exploit the tri-dimensional planned Dose Distribution (3DpDD) to study the correlation with rectal toxicity.
Database and dose preprocessing
A total of 118 patients treated for localized prostate cancer with intensity-modulated radiation therapy (IMRT) were included in the study. The used treatment planning system was Pinnacle V7.4 (Philips Medical System, Madison, WI). The total prescribed dose was 46 Gy to the seminal vesicles delivered in 4.6 weeks, and 80 Gy to the prostate delivered in 8 weeks, with a standard fractionation of 2 Gy per fraction. The patient positioning, CT acquisition, volume delineations and dose constraints complied with GETUG 06 recommendations as described in [3]. For the rectal wall, the constraints were: the maximum dose in 1.8cm 2 had to be lower than 76 Gy and a V72 Gy (volume receiving at least 72Gy) lower than 25%. Rectal toxicity events were prospectively collected and scored according to the Common Terminology Criteria for Adverse Events (CTCAE) version 3.0. The events were defined as rectal bleeding (≥ Grade 1), at least one episode occurring between 6 months and 2 years after RT. Patients with a history of hemorrhoids were not allowed to be scored as Grade 1 bleeding. A total of 31 patients presented at least a Grade 1 late rectal bleeding event. For each patient, the planning data were available: the planning CT, the manual delineation of the organs and planned dose distribution. The rectum of each patient has been described using both the Euclidean distance maps outside the rectum and the Laplacian scalar fields inside the rectum computed for each patient [30-31]. rectal descriptors map were non-rigidly registered using the demons algorithm, towards a selected template to be used as the common coordinate system. This typical selected individual maximized a similarity criterion which is the sum of squared differences computed after rigid registration.
Models
We introduce different approaches which jointly taking advantage of the tri-dimensional pDD to classify patients at high risks of presenting rectal bleeding.
-
First approach: Feature extraction using blind source separation approaches
We studied the efficiency of principal component analysis (PCA) for feature extraction and classification. We compared different possibilities for selecting the most relevant features (sequential and combinatory). An inherent problem of outcome modeling is that the analysis with a large number of variables is computationally expensive. Many features may be extracted from data to provide new representations of the population’s anatomy. The main goal of features selection is to find an optimal subset from a full set of features which provide relevant information to match or improve the performances of classifiers. The performance of the proposed methods is evaluated by computing the sensitivity (Se) and the specificity (Sp).The Se, represents the percentage of patients with rectal bleeding who are correctly identified as having toxicity, and the Sp defines the percentage of patients without rectal bleeding who are correctly identified as not having toxicity. Figure 3 displays the performance of the classier as a function of the number, n, of exploited features when using (a) the sequential approach and (b) the combinatory approach. When using just the best feature (namely the 16th), 92% of rectal bleeding and 80% of non-rectal bleeding patients have been well classified (Se=0.92 and Sp=0.8). The results of accuracy compared to the number of exploited features are represented in figure 3. This work was presented at RITS (Recherche en Imagerie et Technologies pour la Santé) conference, 2013 and published in IRBM, 2013.
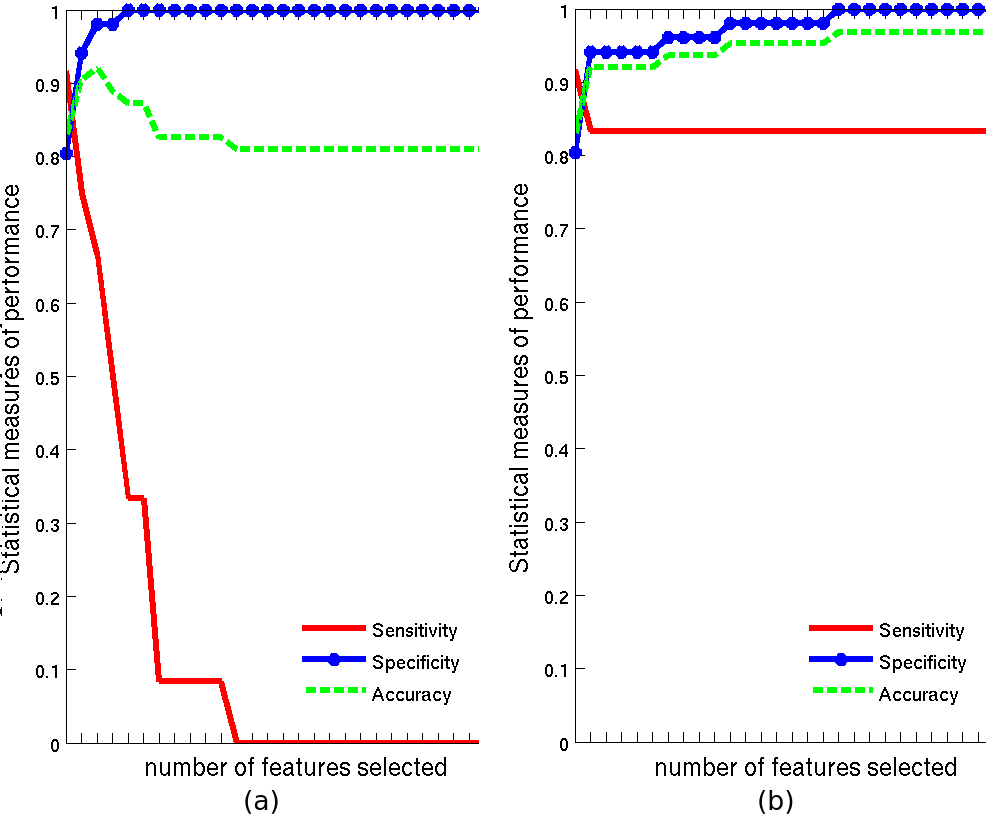
Figure 3. Accuracy, sensitivity and specificity as function of the number of exploited features using: (a) sequential approach, and (b) combinatory approach.
-
Second approach: subspaces representation of both rectal and non rectal bleeding patients
We seek for two bases of vectors built with the tri-dimensional pDD from a population of bleeding and non-bleeding patients,respectively. Then, a patient could be classified according to its distance to the subspaces spanned by both bases.
To obtain these two subspaces, we firstly used Multiway Deterministic Analysis (DMA) technique which aims at finding two bases of vectors from 3D dose distributions of bleeders and non-bleeders patients, respectively, from a Canonical Polyadic (CP) decomposition. Tests on real clinical data demonstrated a 0.76 Se and a 0,89 Sp. It opens the way for potential applications to plan the dose distribution. For a thorough evaluation, we also compared CP-DMA with the Lyman-Kurcher-Burman (LKB) NTCP model. Indeed, it is important to compare our approach to current standard techniques. The Receiver operating characteristic curve (ROC) and the area under the curve(AUC) at the output of the CP-DMA algorithm and the NTCP model are given in figure 4. This work was published to Medical Engineering Physics, 2015.
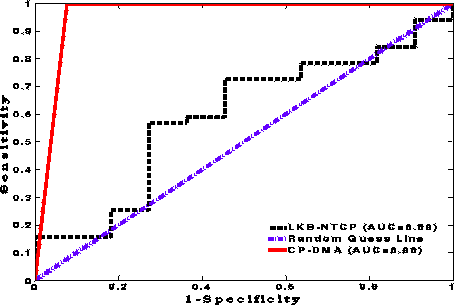
Figure 4. ROC and AUC to predict 2-year grade>1 rectal bleeding for LKB-NTCP model and CP-DMA
Secondly, we tried to use blind source approaches technique like PCA or ICA instead of DMA technique to perform the two bases of vectors. This work was presented at the European SocieTy for Radiotherapy and Oncology (ESTRO) conference, 2013.
Using the whole 3D planned dose distribution, we performed a principal component analysis based approach to predict late rectal toxicity and to construct a dose pattern characterizing the difference between patients with rectal bleeding and those without. The method aimed at identifying, from 3DpDD, two basis (characterizing patients presenting or not rectal bleeding). The method, compared with a recent principal component analysis approach based only on the DVH, showed good performance (AUC=0.87) and suggested that the method is able to establish the correlation between dose and toxicity outcomes (figure 5). This work was presented at the GRETSI conference, 2015. We are writing a paper about this work.

Figure 5. ROC and AUC to predict 2-year grade>1 rectal bleeding using the proposed PCA approach and PCA based on DVH proposed by Sohn et al. [15].
Third, we proposed a new classification method for three-dimensional individuals’ doses, based on a new semi-nonnegative ICA algorithm which aimed at classifying rectal bleeding and non rectal bleeding patients from a population treated for prostate cancer. In order to improve the extraction quality, we exploited this nonnegativity property, giving rise to what we call hereafter the Semi-Nonnegative ICA (SN-ICA). In our context, the components of the mixing matrixcorrespond also to the positive character of dose (which means delivered energy per mass unit at each voxel). This work was published to Journal of Biomedical and Health Informatics 2014.
We also proposed a new method named Discriminant Nonnegative Matrix Factorization (DNMF). This method is based on Non-negative Matrix Factorization and Fisher’s linear discriminant criterion. The proposed method differs from the classical NMF by choosing two subspaces that maximize the distance between the means of the two classes (3DpDD of rectal bleeding versus non rectal bleeding patients) while minimizing the variance within each class. The classification results were 0.77 sensitivity and 0.82 specificity. This work was presented at RITS (Recherche en Imagerie et Technologies pour la Santé) conference, in march 2015 and is published in IRBM, 2015.
Conclusions
Representative features are extracted and used as inputs of a simple classifier with low computational cost comparing two distances. Promising very high performance values were obtained. Forthcoming works include the use of a larger database of patients in order to confirm the efficiency of the method. Finally, these preliminary studies focused on the tri-dimensional pDD in the rectum in order to produce a new efficient predictive models of rectal bleeding after prostate radiotherapy. The proposed approaches jointly uses 3D spatial patterns of dose of several patients sharing the same characteristics. Three-dimensional planned dose distributions and late rectal bleeding appear to be correlated.
General conclusions
Finally, these preliminary studies focused on the planned dose distributions in the rectum in order to produce a new efficient predictive models of rectal bleeding after prostate radiotherapy. pDD and late rectal bleeding appear to be correlated. The obtained results shed some light on the difficult problem of understanding dose-toxicity relationships.
Bibliography
[1] R. De Crevoisier, et al. Changes in the Pelvic Anatomy after an IMRT Treatment Fraction of Prostate Cancer. Int J Radiat Oncol Biol Phys 2007;68(5):1529-36
[2] C. Fiorino, T. Rancati, and R. Valdagni, Predictive models of toxicity in external radiotherapy: dosimetric issues. Cancer 2009, 115(13):3135–3140.
[3] Jackson A., Partial irradiation of the rectum, SeminRadiat Oncol 2001, 11:215-23.
[4] Fiorino C, Rancati T, Valdagni R. Predictive models of toxicity in external radiotherapy: dosimetric issues. Cancer 2009 Jul;115(13 Suppl.):3135–40.
[5] Fiorino C, Valdagni R, Rancati T, et al. Dose–volume effects for normal tissues in external radiotherapy: Pelvis. Radiother. Oncol. 2009;93:153–167.
[6] Cambria DR, Jereczek-Fossa BA, Cattani F, et al. Evaluation of late rectal toxicity after conformal radiotherapy for prostate cancer. Strahlenther. Onkol. 2009;185:384–389.
[7] Marks LB, Yorke ED, Jackson A, et al. Use of normal tissue complication probability models in the clinic. Int. J. Radiat. Oncol. Biol. Phys. 2010;76:S10–19.
[8] Fiorino C, Cozzarini C, Vavassori V, et al. Relationships between DVHs and late rectal bleeding after radiotherapy for prostate cancer: analysis of a large group of patients pooled from three institutions. Radiother. Oncol. 2002;64:1–12.
[9] Marzi S, Arcangeli G, Saracino B, et al. Relationships Between Rectal Wall Dose–Volume Constraints and Radiobiologic Indices of Toxicity for Patients With Prostate Cancer. Int. J. Radiat. Oncol. 2007;68:41–49.
[10] Kupchak C, Battista J, Dyk JV. Experience-driven dose-volume histogram maps of NTCP risk as an aid for radiation treatment plan selection and optimization. Med. Phys. 2008;35:333–343.
[11] Schwarz M, Lebesque JV, Mijnheer BJ, et al. Sensitivity of treatment plan optimisation for prostate cancer using the equivalent uniform dose (EUD) with respect to the rectal wall volume parameter. Radiother. Oncol. 2004;73:209–218.
[12] Buettner F, Gulliford SL, Webb S, et al. Assessing correlations between the spatial distribution of the dose to the rectal wall and late rectal toxicity after prostate radiotherapy: an analysis of data from the MRC RT01 trial (ISRCTN 47772397). Phys. Med. Biol. 2009;54:6535.
[13] Buettner F, Gulliford SL, Webb S, et al. Modeling late rectal toxicities based on a parameterized representation of the 3D dose distribution. Phys. Med. Biol. 2011;56:2103.
[14] Lee R, Chan EK, Kosztyla R, et al. Dose-distance metric that predicts late rectal bleeding in patients receiving radical prostate external-beam radiotherapy. Phys. Med. Biol. 2012;57:8297.
[15] Söhn M, Alber M, Yan D. Principal Component Analysis-Based Pattern Analysis of Dose–Volume Histograms and Influence on Rectal Toxicity. Int. J. Radiat. Oncol. 2007;69:230–239.
[16] Ospina JD, Zhu J, Chira C, et al. Random forests to predict rectal toxicity following prostate cancer radiation therapy. Int. J. Radiat. Oncol. Biol. Phys. 2014;89:1024–1031.
[17] Benadjaoud MA, Blanchard P, Schwartz B, et al. Functional data analysis in NTCP modeling: A new method to explore the radiation dose-volume effects. Int. J. Radiat. Oncol. Biol. Phys. 2014;90:654–663.
[18] Buettner F, et al. Using dose-surface maps to predict radiation-induced rectal bleeding: a neural network approach. Phys Med Biol 2009;54(17):5139.
[19] Buettner F, et al. Modeling late rectal toxicities based on a parameterized representation of the 3D dose distribution. Phys Med Biol 2011;56(7):2103.
[20] O. Acosta, et al. Voxel-based population analysis for correlating local dose and rectal toxicity in prostate cancer radiotherapy. Physics in Medicine and Biology 2013, 58(8):2581–2595.
[21] J. Fripp, et al. Appearance modeling of 11C PiB PET images: characterizing amyloid deposition in Alzheimer’s disease, mild cognitive impairment and healthy aging. Neuroimage 2008, 43( 3):430.
[22] R. Higdon, et al. A comparison of classification methods for differentiating fronto-temporal dementia from alzheimer’s disease using FDG-PET imaging. Statistics in Medicine, vol. 23, no. 2, pp. 315–326, 2004.
[23] O. Bealirs, D. Henson, R. Hutter, et al., American joint committee on cancer: Manual for staging of cancer: Philadelphia. 1992.
[24] V. Beckendorf, S. Guerif, E. Le Prise, et al. 70 Gy versus 80 Gy in localized prostate cancer: 5-year results of GETUG 06 randomized trial. Int J Radiat Oncol Biol Phys, vol. 80, pp. 1056–1063, 2011.
[25] Matthews DE, Farewell VT. Using and understanding medical statistics. Karger Medical and Scientific Publishers; 1996.
[26] M. H. Stenmark, A. S. C. Conlon et al., Dose to the inferior rectum is strongly associated with patient reported bowel quality of life after radiation therapy for prostate cancer. Rad and Onc, vol. 110, no. 2, pp. 291–297, 2014.
[27] I. Turesson, Individual variation and dose dependency in the progression rate of skin telangiectasia. Int. J. Radiat. Oncol. Biol. Phys., vol. 19, pp. 1569–1574, 1990.
[28] J. Thirion, Image matching as a diffusion process: an analogywith Maxwell’s demons. Medical Image Analysis, vol. 2, no. 3,pp. 243–260, 1998.
[29] B. Chen, O. Acosta, A. Kachenoura, J. D.Ospina, G. Drean, A. Simon, J.-J. Bellanger, P. Haigron, and R. deCrevoisier Spatial characterizationand classification of rectal bleeding in prostate cancer radiotherapywith a voxel-based principal components analysis model for 3D DoseDistribution.ProstateCancer Imaging 2011, vol. LNCS 6963, pp.60–69, 2011.