
Multimodal image analysis
Prostate cancer
Prostate cancer (PCa) is a major issue in terms of public health as more than 1.1 million cases of PC were recorded worldwide in 2012, accounting for 15 percent of all new cancer cases in men. It also represented in 2012 more than 300000 deaths worldwide [1]. External beam radiotherapy (RT) is one of the available efficient treatment for localized or locally advanced Pca especially with modern techniques that are able to give high doses of radiation with low rates of side effects [2]. Despite the relative good efficacy of RT, it remains patients that present recurrences. For example, two previously published retrospective studies [3-4] reported long-term biochemical results at 5 and 7 years for ultra-high dose radiotherapy, biochemical recurrence rates according to D’Amico risk group classification [5] were: at 5 years, 98%, 85% and 70%. It is crucial to identify these patients to potentially adapt the treatment. Imaging biomarkers tend to be more and more recognize as powerful helping tools [6].
Role of Local tumor control
Imaging plays an important role in the noninvasive detection, localization, grading, and staging of prostate carcinoma and in carrying out biopsies for histopathologic analysis of the tumor. Multi modal (PET, CT, MRI, …) and multi sequential (various radiotracers) images provide a plethora of information for radiotherapy treatment initial planning [7]. A specific focus will be the use of multi modal images in order to take into account localized tumor characteristics and changes in anatomy and function, not only before but also during treatment. One of the main issues is finding biomarkers able to provide quantitative information from tumor characteristics for improved targeting and assessing the response to the therapy. This novel approach will allow the investigation of the potential use of multi modality imaging in adaptive radiotherapy as a power Aided Decision tool. The goal is to allow the correction of the initial treatment plan according to the information provided by additional images acquired during the treatment [8]. Particularly, multiparametric magnetic resonance imaging (mpMRI) has become a powerful tool to achieve all of these goals. Magnetic resonance imaging (MRI) involves taking pictures of the tissues and internal organs without the use of x-rays. Magnetic resonance imaging (MRI) machines use magnets and radio waves to produce detailed images. MRI guided prostate biopsy is also being used, particularly in those cases where TRUS biopsy is negative. The primary indication for MRI of the prostate is in the evaluation of prostate cancer, after a ultrasound guided prostate biopsy has confirmed cancer in order to determine if there is extracapsular extension. Increasingly MRI is also being used to detect and localize cancer when the PSA is persistently elevated, but routine TRUS biopsy is negative. Both the American College of Radiology (ACR) and European Society of Uroradiology (ESUR) adocate the use of mpMRI in prostate imaging. With its soft-tissue contrast, MRI can enable a more precise delineation of the prostate (see figure 1) and organs at risk (OAR). With mpMRI (diffusion-weighted imaging and/or apparent diffusion coefficient) you can even see metabolically active regions of a tumor.
Role of Multiparametric prostate magnetic resonance imaging
Multiparametric prostate magnetic resonance imaging (MRI) is mainly done for newly diagnosed prostate cancers with good but not perfect performance in cancer diagnostic accuracy, with a sensitivity of 0.78 (95% confidence interval [CI] 0.70–0.84) and a specificity of 0.79 (95% CI 0.68–0.86) [9]. It has also proven its efficacy to guide targeted biopsies especially in case of elevated prostate specific antigen (PSA) and previous negative transrectal ultrasound-guided biopsies [10]. Finally, MRI can be done in case of suspected PC pelvic recurrence [11]. Quantitative analysis of MRI images and in particular Haralick texture analysis [12] is not performed in clinical practice and has only been done in pre-clinical studies [13-14]. Texture analysis has been correlated with patients’ outcomes in breast cancer MRI [15] or in esophageal cancer 18F-FDG positive emission tomography [16].
General purpose
Our first objective is to analyze all the information obtained with MRI by extracting feature to propose an estimated automatic delineation of prostate tumour. Secondly, the purpose is to explore the ability of quantitative prostate T2-weighted (T2-w) and apparent diffusion coefficient maps (ADC) MRI using Haralick texture features: i) to differentiate prostate cancer (PC) from healthy tissues; ii) to be correlated with Gleason score; iii) to predict biochemical recurrence after external beam radiotherapy (RT) for prostate cancer. Finally, part of this work involve making use of MRI information into how this is evolving over time (during the treatment).
Technical pre-requisites
Delineation: prostate and tumour location
A single physician segmented each MRI-T2 sequence separately. The structures delineated were: peripheral Peripheral Zone (PZ), Transitional Zone (TZ) and prostate tumour (Tumour). Those structures were delineated over the MRI-T2 modality using DWI, ADC and DCE-MRI images to support the diagnosis. Typically, PCa tumors appear as hypo-intense regions compared to adjacent prostate tissue in MRI-T2,high signal intensity on DWI images and low signal intensity on ADC apparent diffusion coefficient map and had an early enhancement and an early wash-out DCE-MRI.
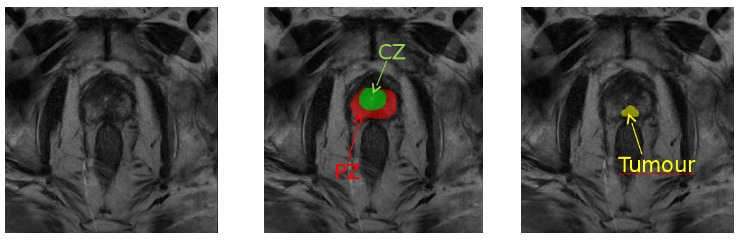
Figure 1: Role of magnetic resonance imaging (MRI) in the prediction of prostate cancer: MRI scan showing suspicious mass of tissue in the prostate gland (slice of T2-weighted MRI in axial view of the pelvic area with tumor outlined in yellow, peripheral zone delineated in red and transitional zone delineated in green).
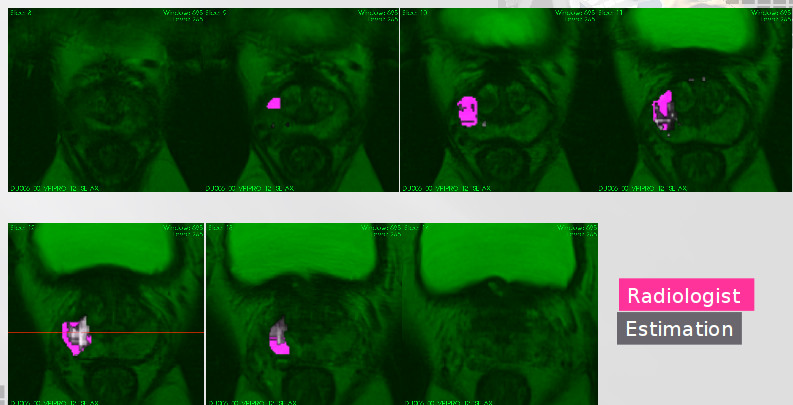
Intra-patient image registration
To extract features corresponding to the same regions in each sequence were used two intra-patient registration steps, firstly, the images of DWI, ADC and DCE-MRI were rigid transformed to the MRI-T2space. This inter-modality registration was achieved comparing the mutual information between the images while realizing an Euler transform. Secondly, to analyses only the evolution within the tumour region, the radiologist delineations in MRI-T2 at the initial state were propagated to the other MRI-T2 images corresponding to the same patient. This step of registration used the delineations previously drawn by the physician, by computing a deformation field within the prostate and after performing a rigid registrations.
Feature extraction
In case DCE-MRI modality, we extract four different features related physical properties of the tissue, namely, wash in coefficient (Ktrans), intra-cellular space (Kev), time necessary to reach the 95% of the maximum value (time to peak) and the total amount of gadolinium uptaken (area under the gadolinium curve) using an in-house implementation of the Toft’s model [17]. Extraction of features in other modalities were computed using Halarick’s texture features [18].
Current works include the extraction of parameters from acquired images and identify those enabling a better differentiation between tissues and a better risk of recurrence prediction. The parameters discriminatory power will evaluated via a study on classification obtained with different parameters.
Models to predict tumour location before the treatment
Purpose
This work compares several modalities of a multiparametric MRI (mpMRI) protocols, namely MRI-T2 weighted (MRI-T2), Diffusion-Weighted Imaging (DWI), Apparent Diffusion Coefficient (ADC) and Dynamic Contrast Enhanced MRI (DCE-MRI) modalities. Each one of these modalities reveals a different phenomenon of tumour behaviour which, mixed and analysed, could shed new light on cancer evolution and recurrence [19]. Currently, however, there is no consensus on the most efficient way to exploit mpMRI information while maintaining clinical meaning. Bearing this in mind, we explore the capacity of functional modalities to describe prostate tissue, allowing differentiate among peripheral zone (PZ), central zone (CZ) and tumour region.
Data processing
Until September 2013, a total of eight patients treated for localized prostate cancer with Intensity-Modulated Radiation Therapy (IMRT) were included in our study. Pinnacle V7.4 (Philips Medical System, Madison, WI) was used as the treatment planning system. The total dose prescribed was 50Gy to the seminal vesicles delivered in 4.6 weeks, and 78Gy to the prostate delivered in 8 weeks, with a standard fractionation of 2Gy per fraction. The patient positioning, Computed Tomography (CT) acquisition, volume delineations and dose constraints complied with GETUG 06 recommendation. The constraints applied to the rectal wall were: the mean dose applied to 1.8cm2 had to be lower than 76Gy and have a V72Gy (volume receiving at least 72 Gy) lower than 25%. Patients with an intermediate prognosis (Gleason Score 8 or Prostate Specific Antigen (PSA) concentration 10.120ng/mL) underwent radiation monotherapy. All eight men who formed the study group (mean age, 71, 74 ± 5.16 years; range, 62 – 81 years) had-biopsy proven prostate cancer. Their average PSA value was 9.54 ± 7.9 and Gleason score between 6 and 7. The state of the tumor in the population was 2 in T 1 and 6 in T 2. These patients underwent imaging with a 3.0T MRI system (SIEMENS Verio 3.0T) with radient strength of 45mT at 200T /m/s; mpMRI includes MRI-T2, DWI(b={0,100,1000}), ADC and DCE-MRI based on MRI-T1.
Feature analysis
Each feature was z-normalized w.r.t. the entire voxel population of every patient. Different combination of features of modalities were evaluated, namely: MRI-T2, ADC, DCE-MRI, {MRI-T2, ADC}, {MRI-T2, DCE-MRI}, {ADC,DCE-MRI} and {MRI-T2, ADC, DCE-MRI}. We used
the minimun Redundancy Maximun Relevance (mRMR) to extract meaningful characteristics that represent TZ, PZ and tumour tissue for MRI-T2, ADC, DCE-MRI, {MRI-T2, ADC}, {MRI-T2, DCE-MRI }, { ADC, DCE-MRI} and {MRI-T2, ADC, DCE-MRI}. mRMR uses a heuristic rule to select a short set of features that best discriminates among different regions (K) [20]. This methodology maximizes the mutual information (mRMR) between a set of selected features (Sj) and the tissue to which it belongs (maximum relevance O) and minimizes the mutual information among the features selected (minimum redundancy R). The features obtained using the mRMR algorithm fed a Support Vector Machine (SVM) classifier configured with a radial basis function kernel. Each feature was consecutively added to the feature vector, beginning from the best ranked feature and finishing with the poorest ranked. The best vector of features was selected as the set of features with the highest value of area under the Receiver Operating Characteristic (ROC) per modality. The data was validated using a Leave One Patient Out (LOPO) strategy.
Predicted segmentation
The arrange of features fed two different classifiers, one to discriminate between TZ and tumour, and another to discriminate between PZ and tumour. We choose the best combination set-of-features that yields the highest performance.
Currently we are writing a paper respect to this subject.
Conclusion
This work presented a comparison among five MRI modalities. To discriminate CZ and PZ from tumour regions, the mRMR algorithm select a similar number of ADC features (3 for CZ and 4 PZ), also maintaining high rates of accuracy, indicating that the cell cluttering and tissue tortuosity differs strongly in prostate cancer (PCa) in both cases. DWI modalities behave fairly well to discriminate between CZ and tumour, but classifying between PZ and tumour, the performance decrease as the b value increase. In this case the result shows that big water movement in the tissue are more important for this task than the smaller ones. Finally, the mRMR algorithm selects four DCE-MRI features to discriminate tumour regions from CZ and two for the other task, it shows that speed and amount of nutrient uptaken are relevant features for PCa tissue recognition.
The ability of MR imaging features to predict biochemical recurrence
Purpose
To explore the ability of quantitative prostate T2-weighted (T2-w) and apparent diffusion coefficient maps (ADC) MRI using Haralick texture features: i) to differentiate prostate cancer (PC) from healthy tissues; ii) to be correlated with Gleason score; iii) to predict biochemical recurrence after external beam radiotherapy (RT) for prostate cancer.
Material and Methods
Tumor and prostate zones were segmented on co-registered T2-w and ADC on two pre-treatment 3.0T MRI from 83 patients with a median age of 67 years (range 50-82 years) and a median pre-treatment PSA was 9.8 ng/ml (range 3.4-48.0 ng/ml). 9 (11%) tumors were localized in the transitional zone (TZ) and 74 (89%) in the peripheral zone (PZ). Tumors were clinically staged as follows: 13% of T1, 46% of T2 and 41% of T3. Gleason scores were as follows: 6 (27%), 7 (51%), 8 (20%) and 9 (2%). They were 2% of low-risk, 33% of intermediate-risk and 65% of high-risk tumors according to D’Amico risk group classification. Almost all patients received standard treatment consisting in IMRT (100%) with IGRT (94%) associated with hormonal therapy in 53% of the patients. After a median follow-up of 47 months (range 19-65 months), 11 patients had biochemical recurrence. A total of 114 grey-leveled features (first order, gradient-based and second order Haralick texture characteristics) and 4 geometrical features (maximal tumor diameter, maximal tumor perimeter, maximal tumor area and tumor volume) were extracted on normalized T2-w and ADC and were analyzed. Statistical analyses were performed using Wilcoxon signed-rank test, Spearman’s correlation coefficient, Harrell’s C-index, Kaplan-Meier curves and univariate Cox regression analysis.
Results
56/57 T2-w and 46/57 ADC maps features were significantly different between tumor and prostate tissues in the peripheral zone (p<0.05). 5 T2-w features and 4 ADC maps features were significantly correlated with Gleason score, all were Haralick texture features. After a median follow-up of 47 months (range, 19-65 months), 11 patients had biochemical recurrence. T2-w features that significantly predicted (p<0.05) biochemical recurrence were: maximal tumor diameter/perimeter/area/volume, Kirsch gradient operator, normalized mean and standard deviation of signal intensity and 8 Haralick texture characteristics. Only normalized mean value on ADC maps was significantly predictive of biochemical recurrence.
Conclusion
Second order Haralick textures are strong features to discriminate prostate cancer, for Gleason score assessment and to predict biochemical recurrence.
Feature evolution during treatment
Purpose
The objective of this study is to describe, model and quantify morphological changes, the response of the prostate cancer and functional MRI prostatic performed during radiotherapy prostatic and hormonotherapy.
Data acquisition and treatment protocol
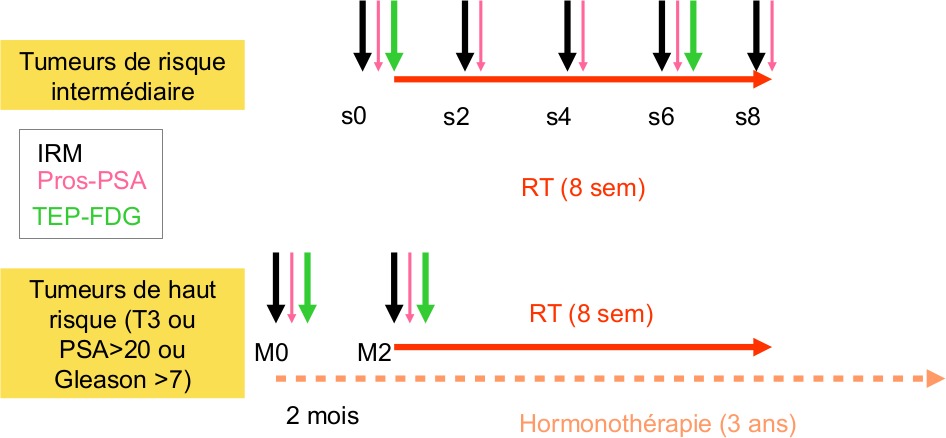
2 groups of patients:
– RT exclusive for intermediate risk tumours (10 patients): 5 MRI will be performed by patient (pre-RT,week 2, week 4, week 6 and week 8), 2 PET (pre-RT, w6), PSAradiotracers prelevements (pre-RT, week 2, week 4, week 6 and week8)
– Hormonotherapy and RT for high risk tumours (10 patients): 2 MRI performed (pre-treatment before hormonotherapy and 2 months after), 2 PET (pre-treatment before hormonotherapy and m2), PSA radiotracers prelevements (pre-treatment before hormonotherapy and m2).
Data processing
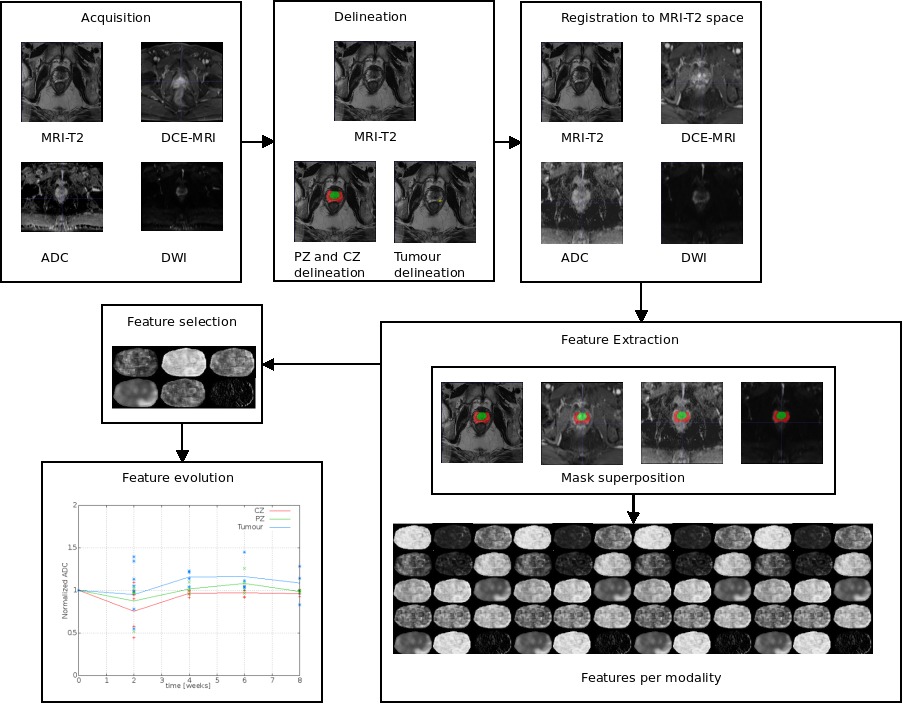
Current works could be divided into different step: delineation, registration, feature extraction, feature selection and feature evolution. This work include the extraction of parameters from acquired images and identify those enabling a better differentiation between tissues and a better risk of recurrence prediction.
The discriminatory power of each parameter will be evaluated via a study on classification. Semiautomatic segmentation methods of the prostate and the tumor will also be developed.
Project workflow
Results
Herein, we developed two different approaches to describe the tissue changes due to RT. The first approach consist in use the delineations made by the radiologist on the pre-treatment mpMRI set of images and its corresponding intermodality/intra-patient propagation, were computed the mean of the intensity within pre-treatment images and the following samples, comparing separately TZ, PZ and Tumour tissue. It allows measure the intensity changes due to RT. The second approach used the most significant features to classify between TZ, PZ and tumour regions in pre-therapy images to discriminate same regions in the following samples, allowing us to analyse voxel tumour changes related to other tissues.
A second approach consist in relate the most relevant modality to separate tumour voxels from healthy tissue to the PSA marker during RT. In the literature shows that PSA value in blood is related with the tumour and prostate sizes [21]. Herein, we extend this notion by adding the effect of extracellular space and tissue tortuosity measured by the ADC modality, i.e., supposing not uniform cell distribution across the prostate. Those tissue characteristics change due to RT and patient specific responses. Currently we are writing a paper about this subject.
General conclusion
This study aims to identify MRI indicators based on cumulated radiation dose in prostate. We also correlated these MRI parameters with biochemical recurrence (PSA serum).
Bibliography
[1] Cancer incidence and mortality worldwide: IARC Cancerbase No. 11
[2] Latorzeff I, Mazurier J, Boutry C, Dudouet P, Richaud P, de Crevoisier R: [Benefit of intensity modulated and image-guided radiotherapy in prostate cancer]. Cancer Radiothérapie J Société Fr Radiothérapie Oncol 2010; 14:479–87.
[3] Cahlon O, Zelefsky MJ, Shippy A, et al.: Ultra-high dose (86.4 Gy) IMRT for localized prostate cancer: toxicity and biochemical outcomes. Int J Radiat Oncol Biol Phys 2008; 71:330–7.
[4] Spratt DE, Pei X, Yamada J, Kollmeier MA, Cox B, Zelefsky MJ: Long-term Survival and Toxicity in Patients Treated With High-Dose Intensity Modulated Radiation Therapy for Localized Prostate Cancer. Int J Radiat Oncol 2013; 85:686–92.
[5] D’Amico AV, Moul J, Carroll PR, Sun L, Lubeck D, Chen M-H: Cancer-specific mortality after surgery or radiation for patients with clinically localized prostate cancer managed during the prostate-specific antigen era. J Clin Oncol Off J Am Soc Clin Oncol 2003; 21:2163–72.
[6] Prestwich RJD, Vaidyanathan S, Scarsbrook AF: Functional Imaging Biomarkers: Potential to Guide an Individualised Approach to Radiotherapy. Clin Oncol R Coll Radiol G B 2015.
[7] J.L. Lagrange, et al. Image guided radiationtherapy (IGRT). Bull Cancer 2010.
[8] G. Cazoulat, et al.Fromimage-guided radiotherapy to dose-guided radiotherapy. CancerRadiother 2011;15(8);691-8.
[9] Hamoen EHJ, de Rooij M, Witjes JA, Barentsz JO, Rovers MM: Use of the Prostate Imaging Reporting and Data System (PI-RADS) for Prostate Cancer Detection with Multiparametric Magnetic Resonance Imaging: A Diagnostic Meta-analysis. Eur Urol .
[10] Sciarra A, Panebianco V, Cattarino S, et al.: Multiparametric magnetic resonance imaging of the prostate can improve the predictive value of the urinary prostate cancer antigen 3 test in patients with elevated prostate-specific antigen levels and a previous negative biopsy. BJU Int 2012; 110:1661–5.
[11] Westphalen AC, Reed GD, Vinh PP, Sotto C, Vigneron DB, Kurhanewicz J: Multiparametric 3T endorectal mri after external beam radiation therapy for prostate cancer. J Magn Reson Imaging JMRI 2012; 36:430–7.
[12] Haralick RM, Shanmugam K, Dinstein I: Textural Features for Image Classification. IEEE Trans Syst Man Cybern 1973; SMC-3:610–21.
[13] Wibmer A, Hricak H, Gondo T, et al.: Haralick texture analysis of prostate MRI: utility for differentiating non-cancerous prostate from prostate cancer and differentiating prostate cancers with different Gleason scores. Eur Radiol 2015:1–11.
[14] Viswanath SE, Bloch NB, Chappelow JC, et al.: Central Gland and Peripheral Zone Prostate Tumors have Significantly Different Quantitative Imaging Signatures on 3 Tesla Endorectal, In Vivo T2-Weighted Magnetic Resonance Imagery. J Magn Reson Imaging 2012; 36:213–24.
[15] Ahmed A, Gibbs P, Pickles M, Turnbull L: Texture analysis in assessment and prediction of chemotherapy response in breast cancer. J Magn Reson Imaging 2013; 38:89–101.
[16] Tixier F, Rest CCL, Hatt M, et al.: Intratumor Heterogeneity Characterized by Textural Features on Baseline 18F-FDG PET Images Predicts Response to Concomitant Radiochemotherapy in Esophageal Cancer. J Nucl Med 2011; 52:369–78.
[17] Tofts, P., Modeling tracer kinetics in dynamic gd-dtpa mr imaging, Journal of Magnetic Resonace Imaging 7, 91 – 101 (1997).
[18] Haralick, et al, Textural features for image classification. IEEE Trans-actions on systems man and cybernetics 3, 610 – 621 (1973).
[19] Tiwari, P., Viswanath, S., Kurhanewicz, J., and Madabhushi, A., “Weighted combination of multi-parametric MR imaging markers for evaluating radiation therapy related changes in the prostate,” Prostate Cancer Imaging, leturenotes in computer science 6963, 80 – 91 (2011).
[20] Hanchuan Peng, et al. Feature selection based on mutual information: Criteria of max-dependency, max-relevance, and min-redundancy. IEEE Transactions on pattern analysi and machine intelligence, 27:1226 – 1238, 2005.
[21] Kristin R. Swanson, et al. A quantitative model for the dynamics of serum prostate-specific antigen as a marker for cancerous growth. An explanation for a medical anomaly. American Journal of Pathology, 158(6):2195 – 2199, June 2001.