Multi-valued 3D+Time images acquired with cutting-edge microscopy and molecular engineering technologies, are complex for scientists to detect and visualize “on the fly” biological events and processes. Accordingly, we developed visualization, navigation, and interaction methods to facilitate exploration of temporal series of multi-valued volumetric microscopy images depicting live cells and tissues.
IMAGE ACQUISITION/RECONSTRUCTION, AND 3D DYNAMICS ANALYSIS
1. Acquisition an restoration of large 3D fluorescence microcopy images and videos
In the past, the study of cellular dynamics has proven difficult because of lack of sensitivity, limited recording speed, photo-bleaching and photo-toxicity associated with conventional imaging modalities. Advanced approaches such as lattice light-sheet microscopes (LLSM), among others, overcome these difficulties. The advances in imaging gives biologists the possibility to observe a series of sequential events, such as the complete vesicular transporter dynamics, from budding to final fusion within a single cell, without space-time compromise (SERPICO/STED teams) or the development of a floral meristem of Arabidopsis thaliana composed of several hundreds of cells (MOSAIC/MORPHEME teams). As another example, point cloud data explored by the LOCCO Team team, such as those generated by single-molecule localization microscopy (SMLM), are constantly increasing in size and dimension. A key step for visualization and interpretation is to improve the quality of raw 3D images and videos that is known to be limited by out-of-focus blur and high noise. In the project, the SERPICO/STED teams developed a flexible algorithm (SPITFIR(e) to efficiently restore 3D images and videos acquired with varied fluorescence microscopy modalities such as lattice light sheet, stimulated emission depletion, multifocus microscopy, spinning disk confocal microscopy, and confocal multi-array detector microscopy.
_____________________________________________________________________________________________________________________________________
2. Particle tracks, molecular mobility, and dense motion estimation and visualization on 2D screens
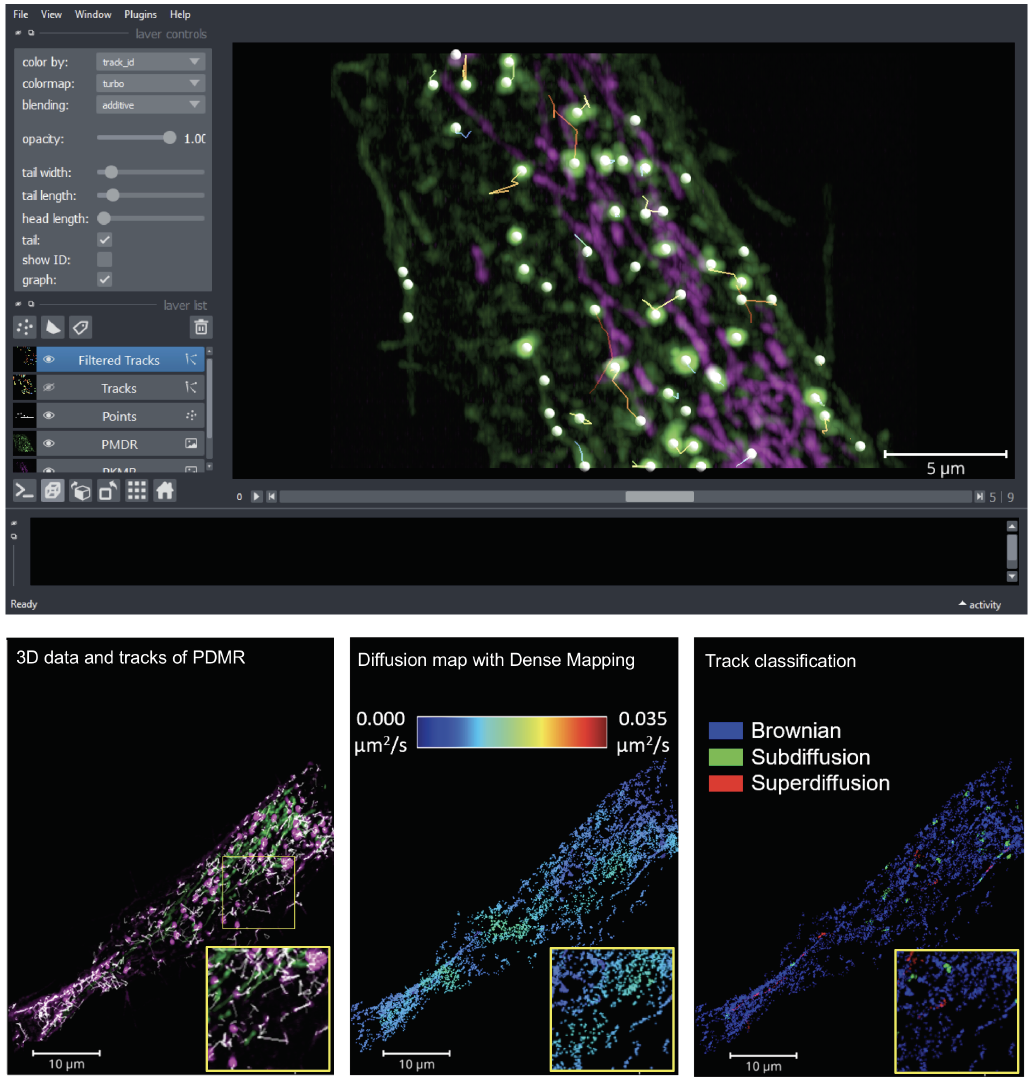
The analysis of intracellular dynamics requires the design of image analysis pipelines combining several pieces of image processing modules and software (filtering, detection, tracking, etc.). In that context, the SERPICO/STED teams developed STracking, a Python library that combines particle detection, tracking and analysis methods. It can be used via a napari visualization plugin to analyze very large microscopy datasets (Fig. 1, top) .
Meanwhile, it is well established that particle tracks provide cues to quantify molecular interactions and diffusion mechanisms in space and time. Accordingly, the DenseMapping method (SERPICO/STED teams) was developed to estimate molecular dynamics and to map 2D-3D drift vectors and diffusion coefficients of moving particles (Fig. 1, bottom).
 FIGURE 1 – Top: STracking library implemented in its napari plugin. Fifty-five planes 3D volumes of live RPE1 cells double stained with PKMR for Mitochondria (magenta) and with plasma membrane deep red (PMDR) for endosomal pathway (green) were acquired within 4.3 s per stack using Lattice light-sheet Structure Illumination Microscopy (LLS-SIM). STracking is illustrated here with single particle tracking of endosomal pathway (PMDR). 3D data and tracks are rendered using the napari viewer. Bottom: Diffusion map estimation applied to LLS-SIM; left: series of 3D volumes of live RPE1 cell double stained with PKMR for Mitochondria (green) and with plasma membrane deep red (PMDR) for endosomal pathway (magenta); middle: spatial high-resolution diffusivity map estimated by DenseMapping; right: classification of track into three diffusion types: Brownian motion, subdiffusion and superdiffusion.
_____________________________________________________________________________________________________________________________________
3. Spatiotemporal image segmentation and cell tracking
In order to quantitatively study the development of complex organisms from 3D temporal data, a prerequisite step is the ability to track cell membranes over time. The MOSAIC/MORPHEME teams therefore tackled this biocomputing challenge and focused on the development of more robust new pairing approaches required to study the development of the floral meristem of Arabidopsis thaliana. To address the underlying issues, the classical two-step procedure that consists in segmenting each cell in each image (step #1) and then temporally associating the segmentations of the consecutive images of the sequence (step #2), was significantly improved. The spatiotemporal registration of 3D+Time sequences makes possible to match regions at similar stages of development and potentially to perform genetic information comparisons between meristems (Fig. 2).
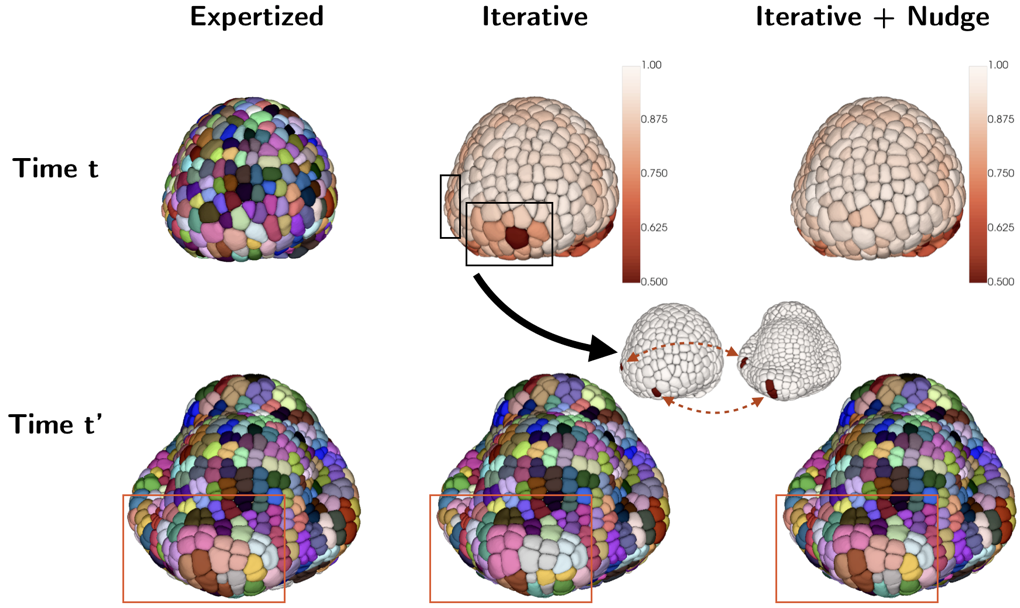
FIGURE 2 – Visualization of the detection and correction of potential tracking errors using nudges on pair of time-points t=112 h (mother image) and t’=128 h (daughter image). First column corresponds to the expertized mapping expected between mother (top) and daughter (bottom) images. Second column corresponds to the TQA score map of the iterative mapping (top) and its corresponding daughter image (bottom). For each potential error regions found in the TQA map (black rectangles), a pair of landmarks is manually set. Third column corresponds to the TQA score map of the mapping obtained after the use of nudges (top) and its associated daughter image (bottom).
_____________________________________________________________________________________________________________________________________
VISUALIZATION AND INTERACTION WITH AR/VR APPROACHES
The usual methods of visualization and interaction, such as temporal sliders, animation, or the juxtaposing a few time points, are limited when fine-grained analysis of dynamic features is required. The usual difficulty is thus related to dimensionality since humans cannot represent and fuse 4D-5D multivalued raw data and features (e.g. tracks), even assisted by visualization software displaying information on 2D screens. Accordingly, several teams have investigated Augmented Reality (AR) and Virtual Reality (VR) to better explore and interact with the content of multidimensional, multi-valued images.
1. Immersive visualization of 3D-4D microscopy image data and analysis
The LOCCO/BDC teams have developed platforms generating volumetric reconstructions from stacks of 3D+Time microscopy images and facilitating efficient visualization, selection of structures of interest and quantitative analysis (DIVA) (Figs. 3B, C), as well as to visualize and analyze point clouds in VR, particularly adapted to SMLM data (Genuage) (Figs. 3D, E). In both tools, data are imported in their raw format and visualized in VR using custom shaders. It goes beyond static data, as the visualization and interaction are optimized for dynamic data exploration over time (Figs. 3C, E), combined with other information (Figs. 1D, E). Moreover, the LOCCO/BDC teams recently showed that coupling data annotation in VR with one shot learning (learning without a database) can significantly accelerate microscopy image segmentation.
Meanwhile, in the context of real-time visualization of 4D data, the MOSAIC/HYBRID/SERPICO/STED teams focused on the design of novel immersive visualization methods to allow biologists to explore complex datasets (embryo development dataset (MOSAIC) and endosomes dynamics dataset (SERPICO/STED). In this context, an extension of the Space-Time Cube (STC) visualization technique to 4D data was proposed. The so-called Space-Time Hypercube (STH) approach considers that the data lays in a 4D hypercube with three spatial dimensions and one temporal dimension (Fig. 4).
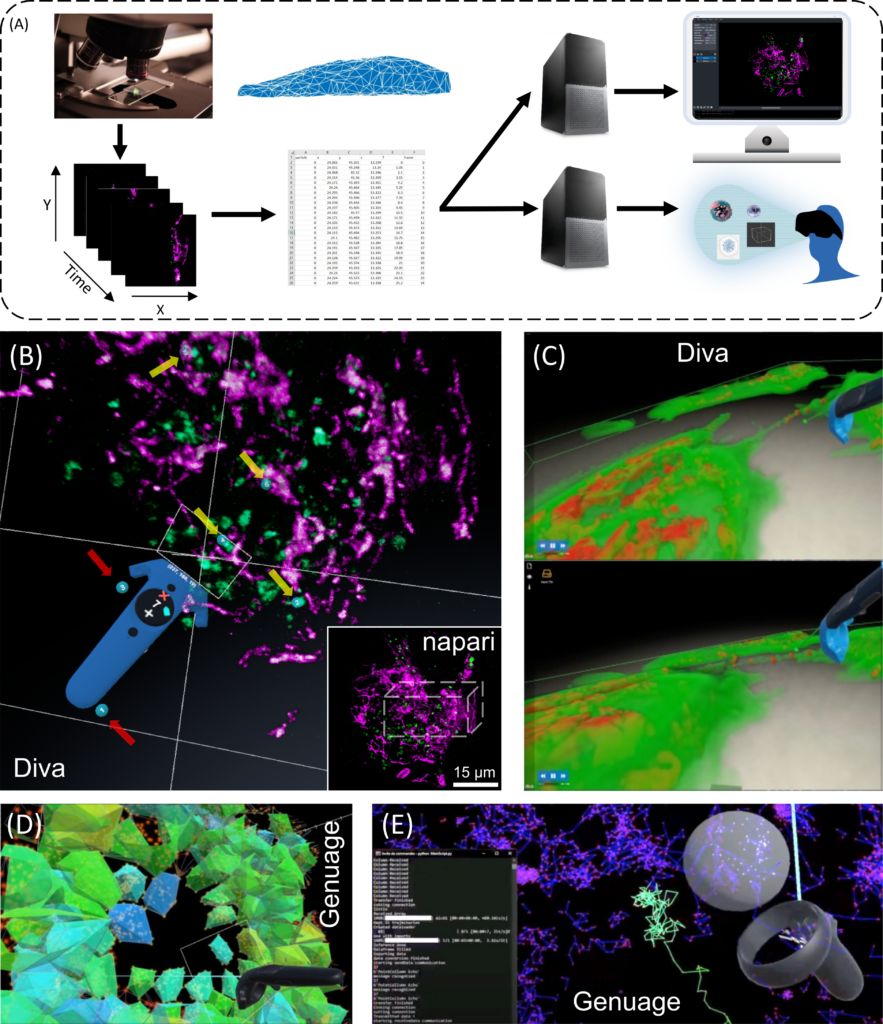
FIGURE 3 – Exploring 3D+Time intracellular microscopy data. (A) 3D+Time visualization modes. Flat screen and VR/AR share identical processes. From left to right, image acquisition and preprocessing (denoising, registration, reconstruction, and deconvolution); post processing (segmentation, mesh, and tracking analysis) and data annotation constitute similar input. Fork in the road starts at a downstream computing level for 3D rendering, which differs between flat screen and VR/AR visualizations, with additional interactive tools for the latter (e.g., Microsoft Hololens, Headsets, Oculus, eye trackers, haptic gloves). (B) VR visualization an interaction using DIVA of a live RPE1 cell expressing CD63-Turquoise.2 labeling late-multivesicular endosomes and stained with PKMOrange, labeling mitochondria acquired with LLSM. Diving into the stack allows precise selection in 3D and it allows to adapt the angle of vision of green structures of interest (endosomes) (yellow arrows, numbered blue tags), accordingly to their distance to the magenta structures (mitochondria). Continuous visual penetration in the 3D space allows to precisely select more of them (yellow arrows, numbered blue tags) while previously selected ones remain tagged (red arrows, numbered blue tags). Coordinates and information of the selected structured are recorded for further analysis and tracking in time. In the inset thumbnail image, a corresponding full 3D stack of 54 planes of the same cell is shown using the napari viewer, where the parallelepiped white box depicts the volume manipulated in DIVA. The same original 3D+Time data set is also used in Figures 4D,E. (C) Dynamic exchange of mitochondria between cells using Tunneling Nanotubes (TNT) visualized with DIVA in VR. Rendering is performed by full volumetric ray casting and an adapted transfer function. Note the possibility to have both the video running and the user interacting with the data. Exploring 3D single particle trajectories in time using Genuage (D, E). Data are initially presented as point clouds and segment in Genuage, while physical properties maps (D), such as coefficient diffusion are overlaid to the point cloud and explored in VR. (E) Example of real time analysis using a pre-trained neural network of a selection of points. Interaction with the data and rendering in VR is not affected during the analysis.
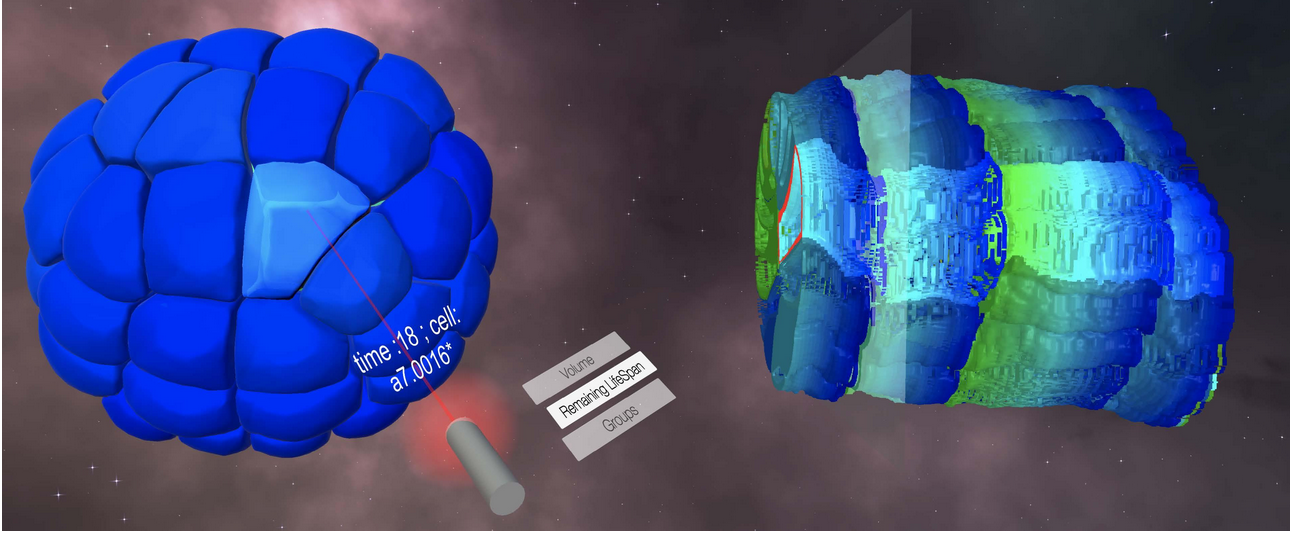
FIGURE 4 – Juxtaposed views in a virtual environment of a mesh (left) alongside a “Space-Time Cube” (right), extracted from a 3D recording of an embryo development. Interactions are synchronized between the representations.
_____________________________________________________________________________________________________________________________________
2. AR for immersive visualization of dynamic compounds in living cells
An interface was designed (Fig. 5A) for the interactive exploration of particle trajectories within living cells (e.g., endocytosis vesicles). In this study, the AVIZ/MaIAGE/SERPICO/STED teams evaluated collaborative data exploration scenarios and thus used an AR headset, Microsoft’s HoloLens 2. This technology allows a semi-transparent volumetric representation of a cell that highlights its contour without losing the context of the surrounding room (Fig. 5A, B; right), to show the trajectories of the segmented and tracked objects of interest as opaque linear representations (Fig. 5B; right) while interacting with panning, zooming, and rotating. To create an immersive analysis environment, in addition to the 3D data display, it is also necessary to use abstract data visualizations. Specifically, a linked-view dashboard was created that includes both 3D representations and abstract data views, with the latter serving primarily to provide context, filtering, and highlighting of data in the main 3D view (Fig. 5A). AR can also exploit tablet technology as illustrated in Fig. 5C using data launched in the web browser MorphoNet.
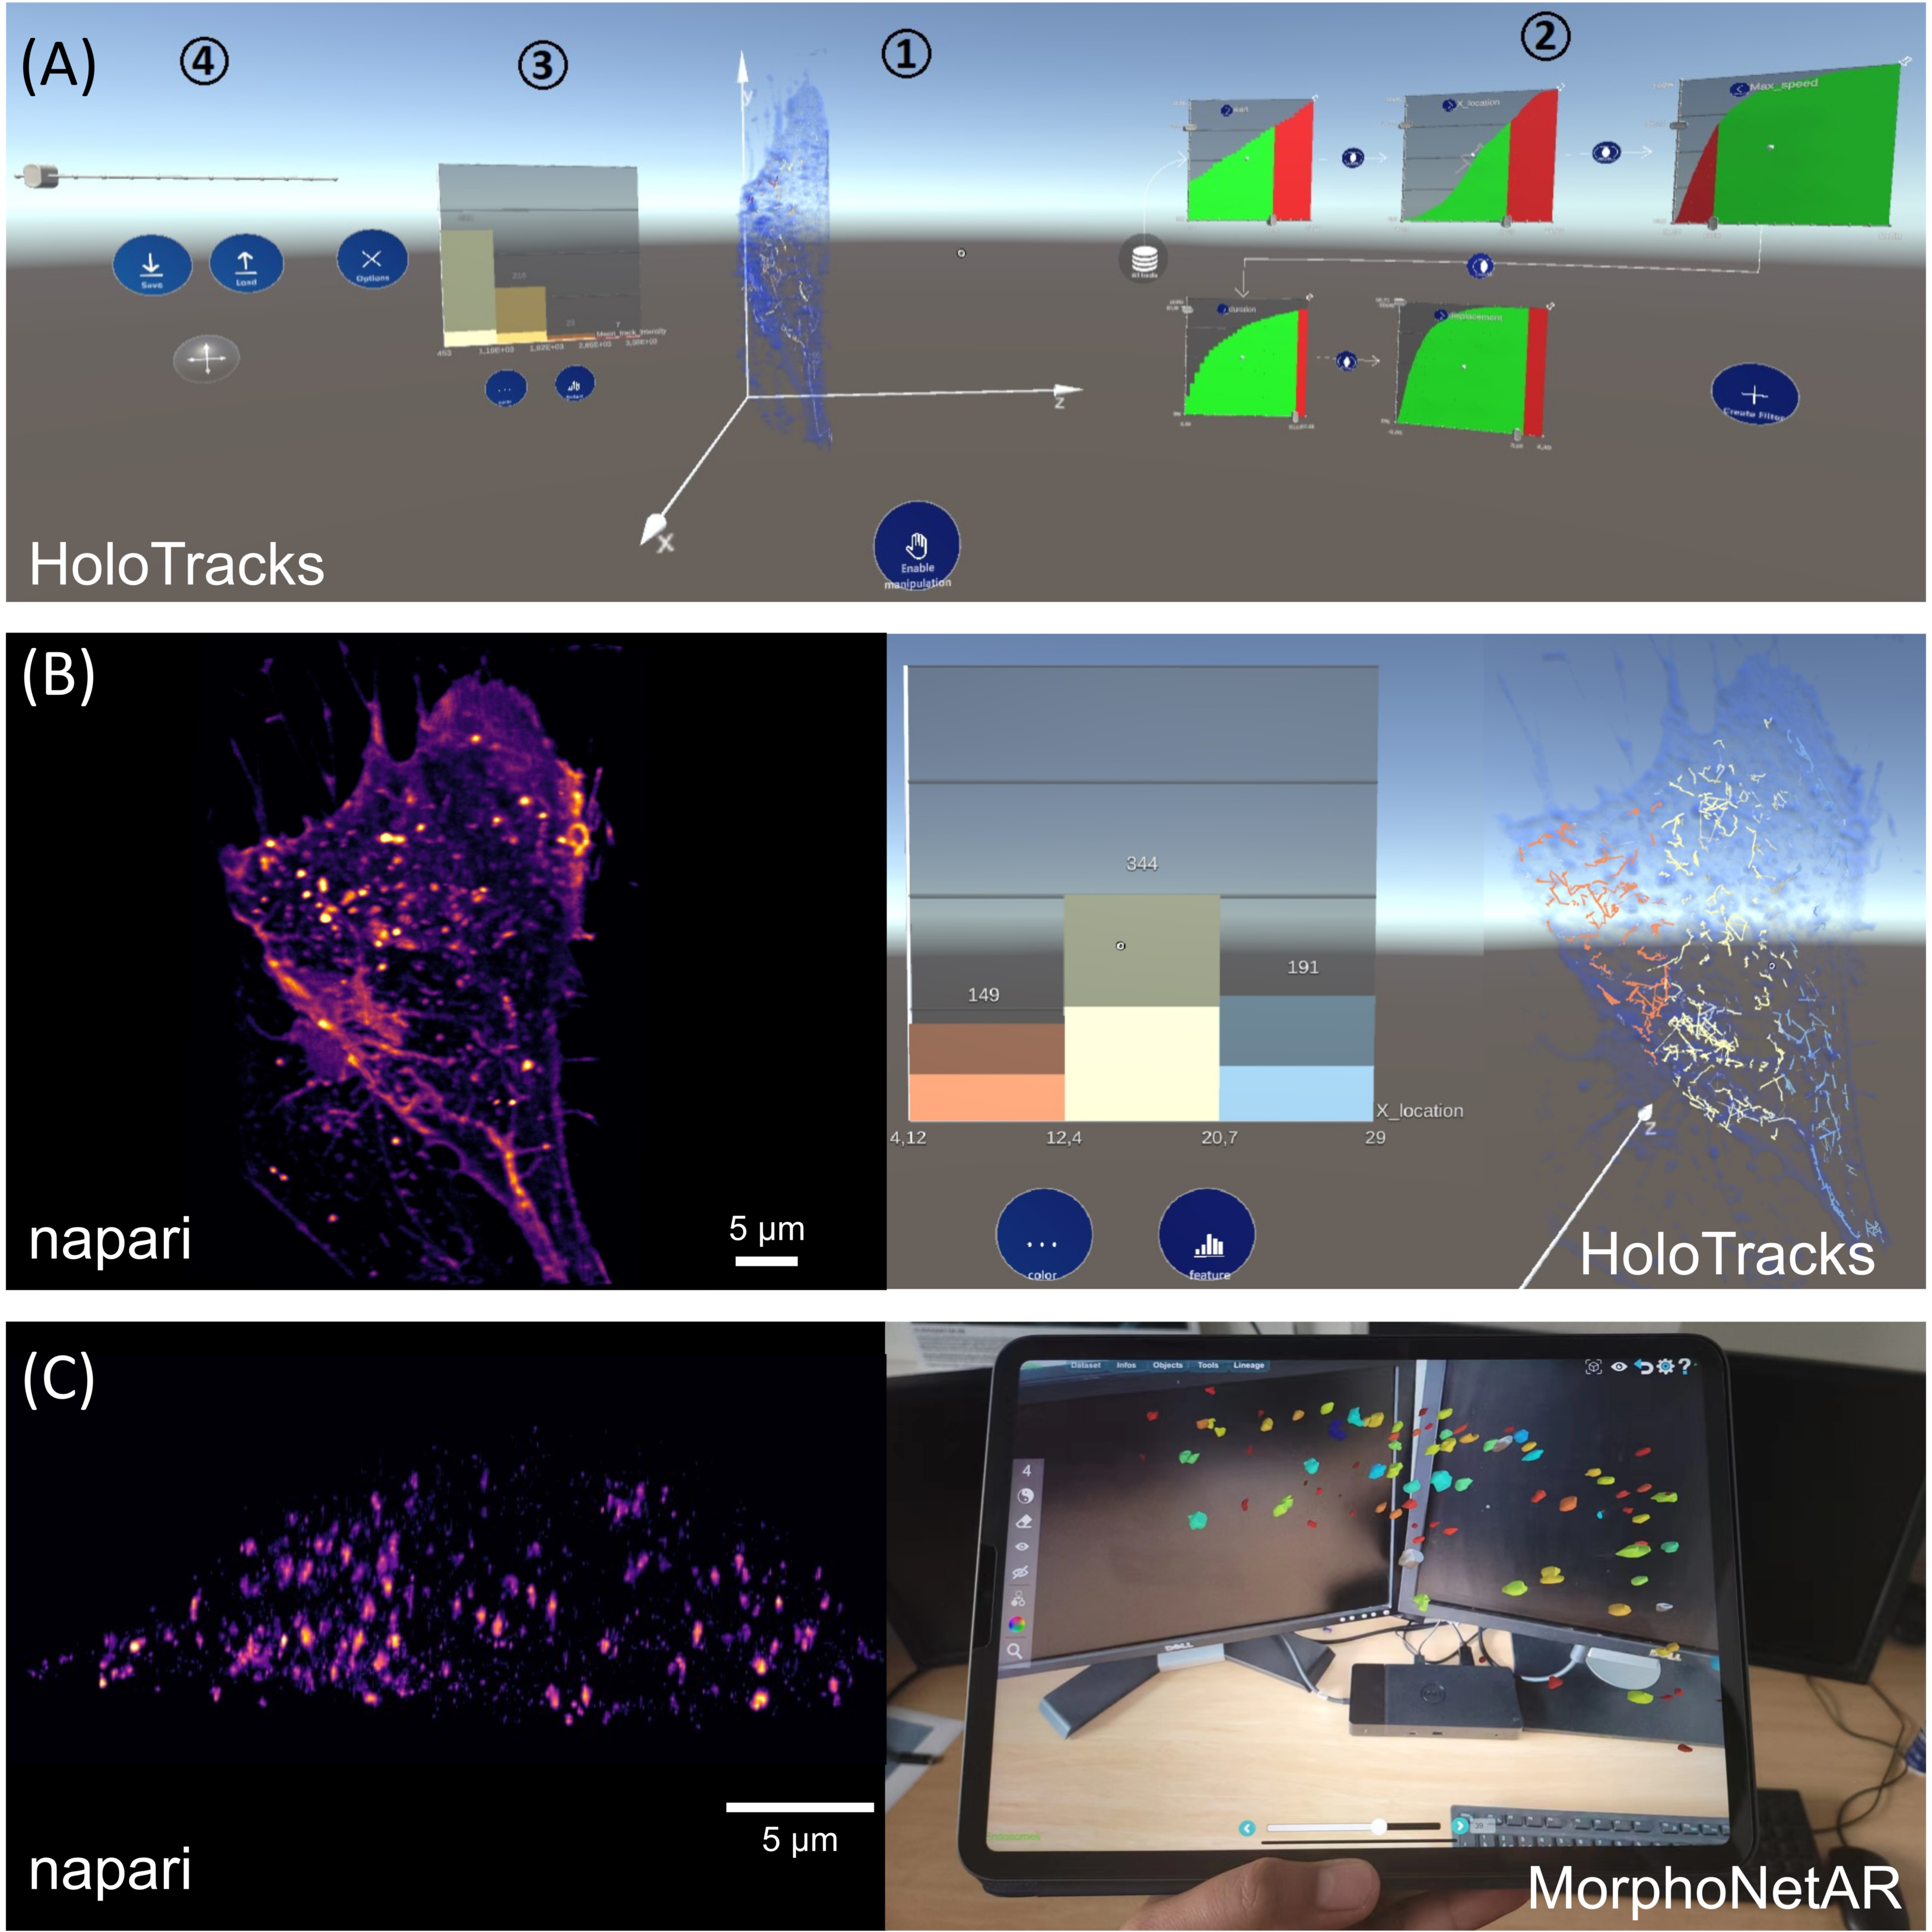
FIGURE 5 – Other VR/AR developments and perspectives for VR/AR integration in the 3D + time digital microscopy landscape. (A–C) Augmented reality visualization (HoloTracks) of live RPE1 cell stacks acquired by Lattice Light Sheet microscopy after 1 h of incubation at 37°C with Plasma Membrane CellMask™ staining (ThermoFisher, Bordeaux, France) to label the endosomal pathway. Tracking of labeled vesicles was performed with Trackmate (Ershov et al., 2022). (A) Augmented Reality data dashboard that combines a 3D view (1) with several abstract data views (2 and 3) and interactive elements (1, 2, and 4) showing 3D view and possible data exploration (filter settings and resulting histograms) or view manipulations as facilitated by theMicrosoft HoloLens 2 headset. (B) Paired images showing the same cell sample, using napari viewer (left image) and HoloTracks (right image) with color map of tracks visualization of moving endosomes and histograms of three distributions as selected by filtered settings. (C) Napari (left image) and augmented reality visualization using tablet technology (MorphoNetAR; right image) of one stack of a live Hela cell stably expressing eGFP-Rab5 acquired using LLSM. Data were segmented and the color map indicates volumes of Rab5 positive early endosomes.
_____________________________________________________________________________________________________________________________________
3. Fom traditional to 3D timelines in VR for image data exploration
The MOSAIC/HYBRID/SERPICO/STED teams also proposed to extend timeline representations to temporal 3D microscopy data (endosomes dynamics dataset (SERPICO/STED) (Fig. 6) and Phallusia Mammillata embryo development dataset (MOSAIC) (Fig. 7)) in VR. 2D Timelines typically display temporal information, e.g., a series of events, in a linear fashion along an axis or as a tree. This representation is very flexible, producing expressive visualizations that can be adapted to support a narrative or highlight specific temporal features. The MOSAIC/HYBRID teams implemented this work on timeline visualizations in the already distributed MorphoNet software. Most of the dataset transformation and manipulation from MorphoNet were replicated in VR (Fig. 7).
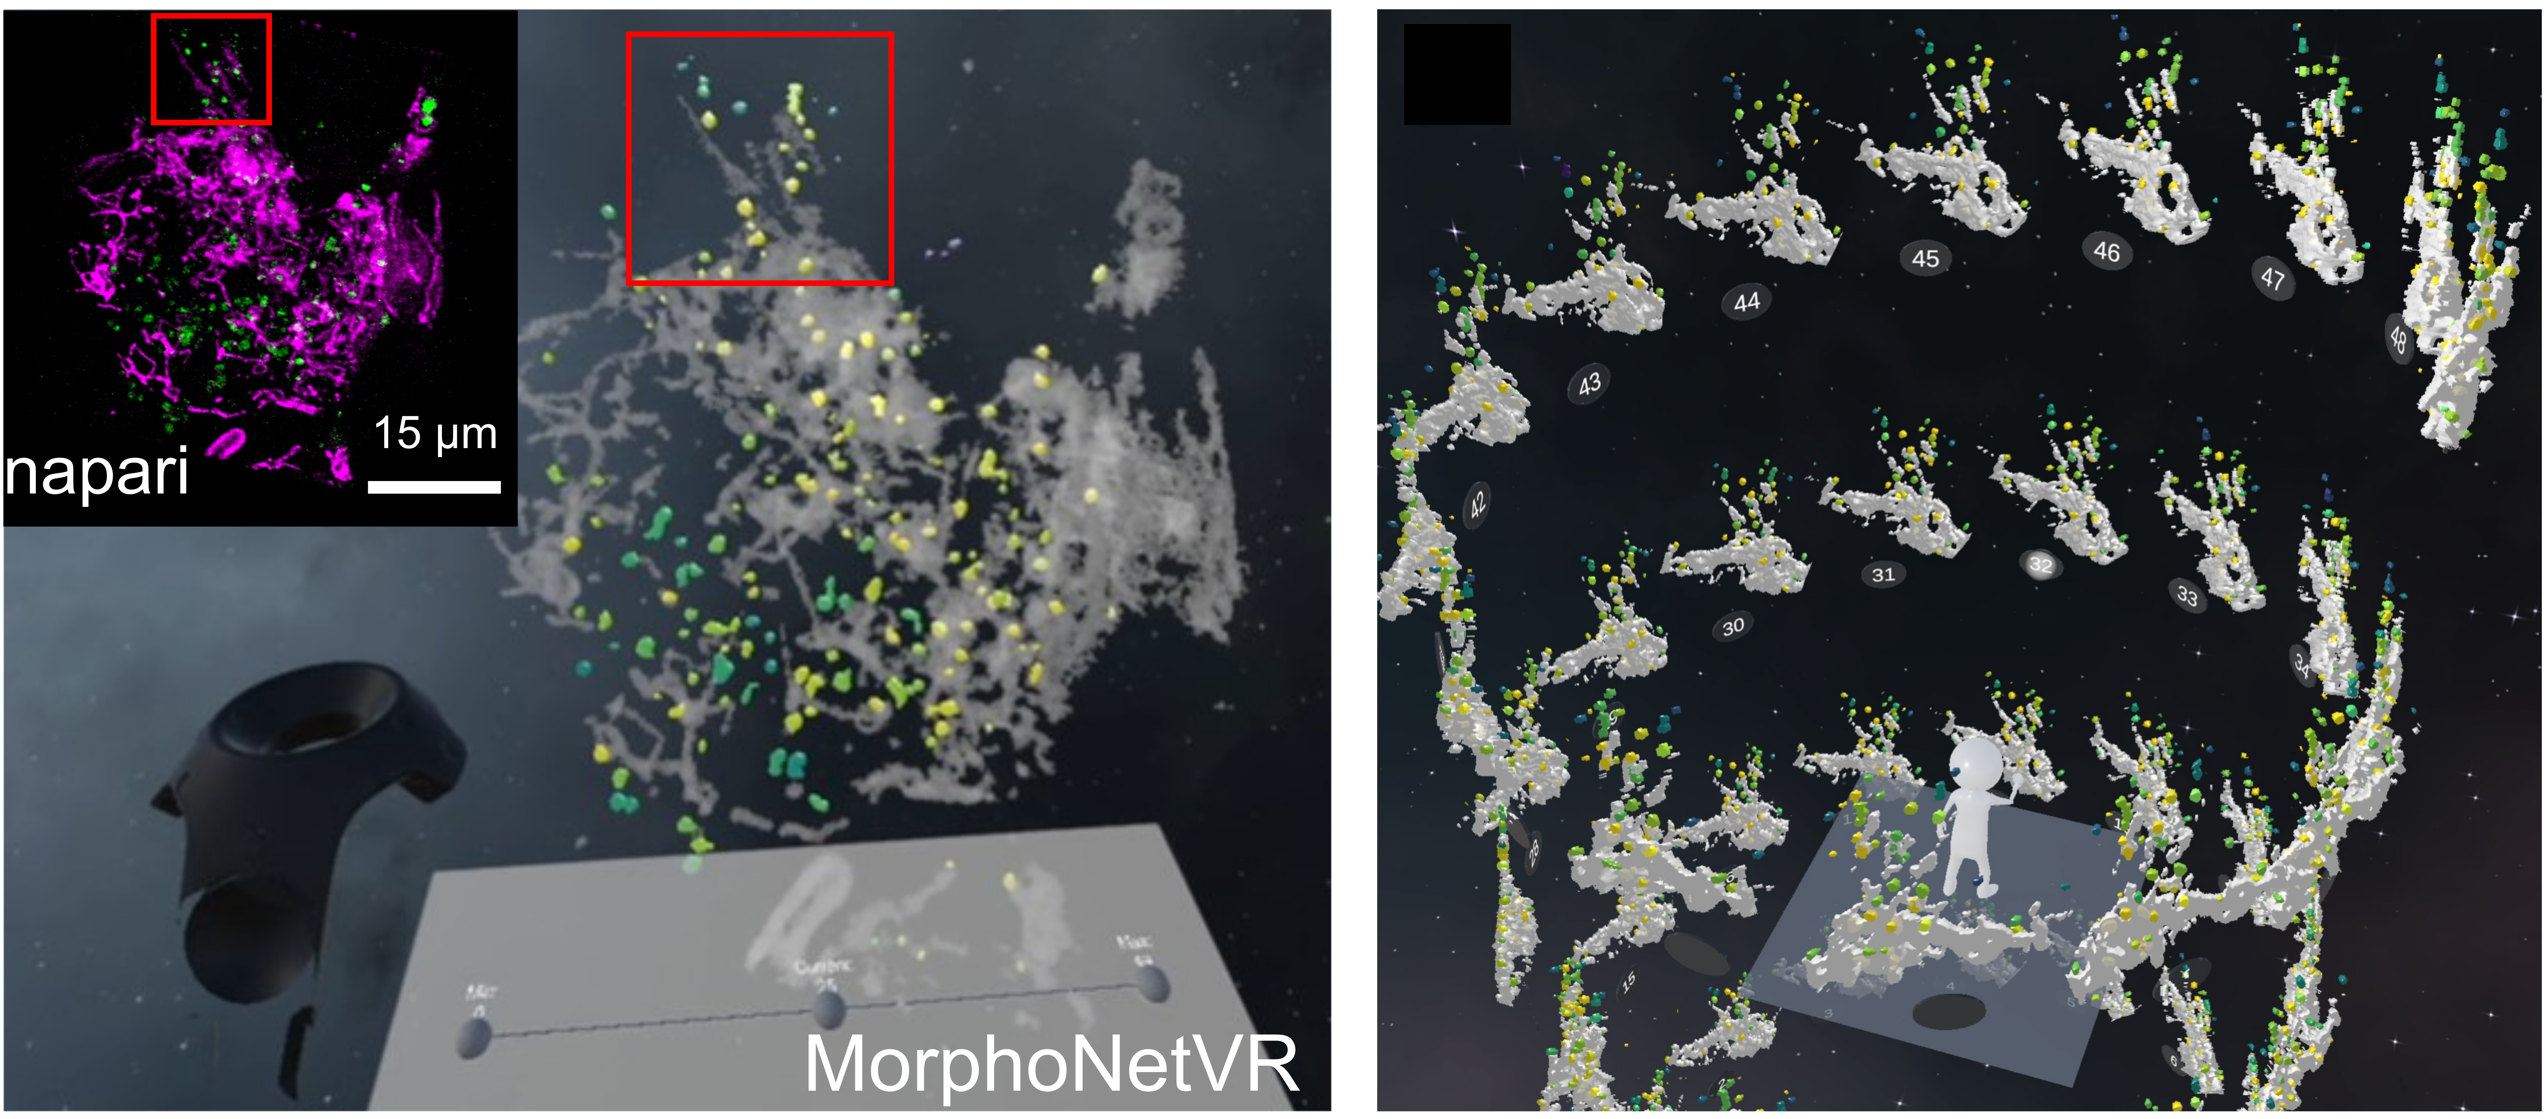
FIGURE 6 – Quantitative visualization using virtual reality of a live RPE1 cell expressing CD63-Turquoise.2 labeling late-multivesicular endosomes and PKMOrange labeling mitochondria acquired with LLSM (MorphoNetVR). A full 3D stack of 54 planes at one time point is shown (see full movie in Supplementary Video S3). The colormap of late endosomes represents the distance tomitochondria (green-far and yellow-near). Mitochondria network is represented in grey. The inset thumbnail image represents the flatscreen visualization using napari viewer of the same 3D stack with the same viewing angle (endosomes in green; mitochondria in magenta). (Right) 3D Timeline design space in MorphoNetVR extracted from a subregion of interest indicated by boxes in (left) and in the thumbnail in (left).
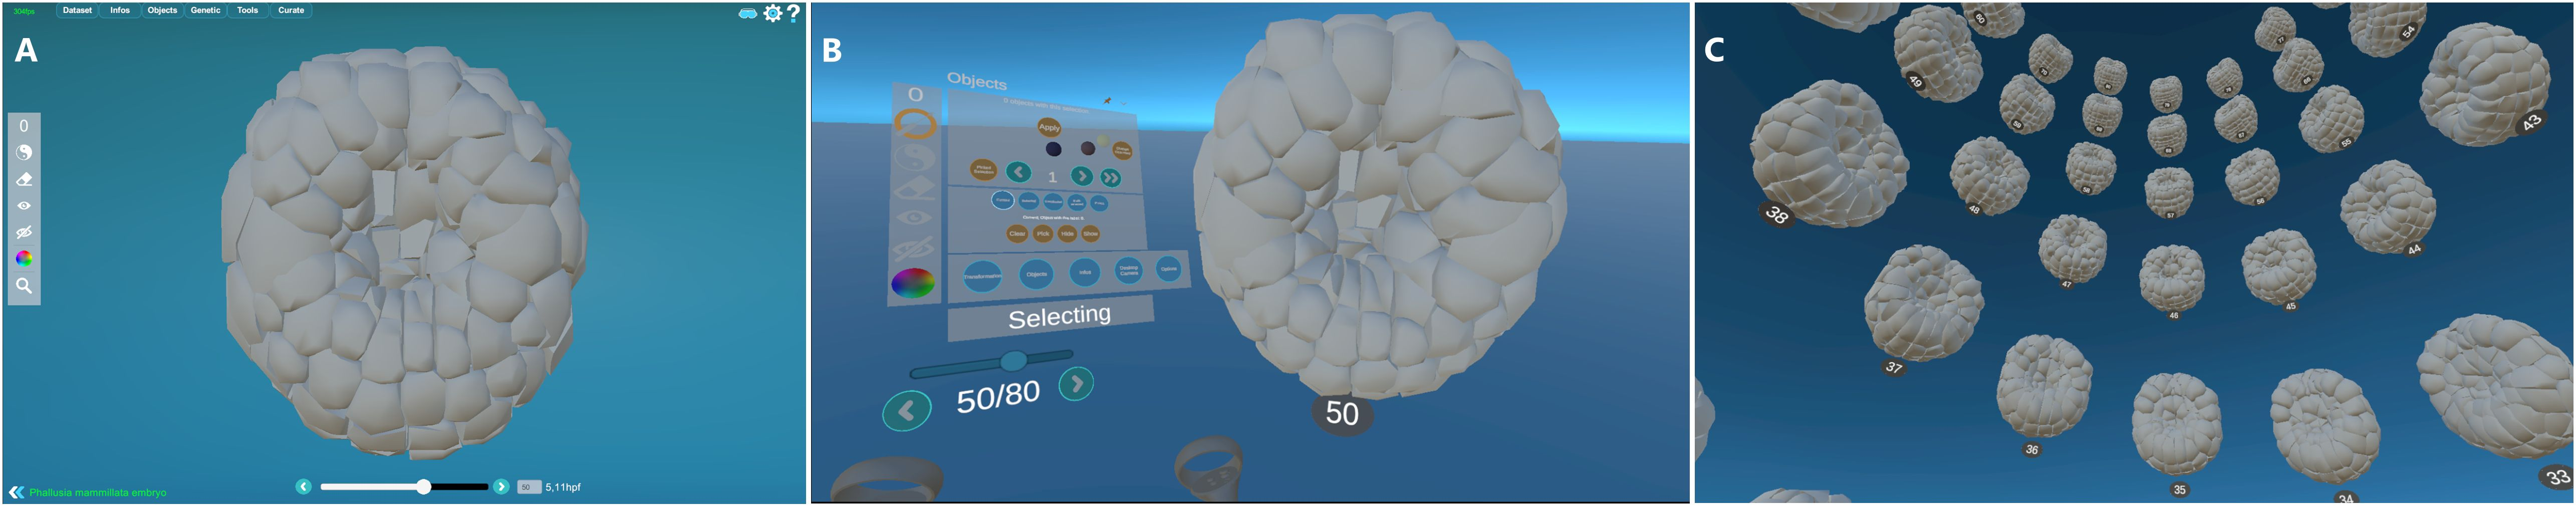
FIGURE 7 – Desktop and VR view in MorphoNet. (A) 3D view of Phallusia Mammillata embryo in the desktop environment. (B) 3D view of Phallusia Mammillata in the VR environment. (C) 3D view of Phallusia Mammillata with a helicoidal timeline visualization of the evolution of the embryo.
_____________________________________________________________________________________________________________________________________
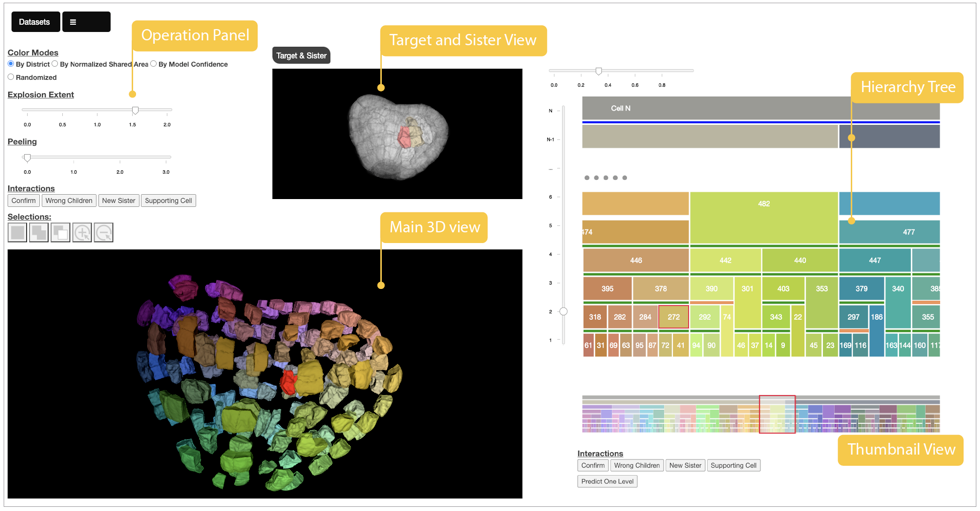
4. Machine learning supported interactive visualization of hybrid 3D and 2D data.
The AVIZ and MaIAGE teams addressed the cell lineage problem for plant embryos as an example to investigate a visualization system and its interaction design that makes use of combinations of 3D and 2D representations as well as visualization for machine learning. They first investigated the 3D selection interaction techniques for the plant embryo. Second, a system (LineageD (Fig. 8) with combinations of 2D and 3D representations was designed to examine the plant cells and record the development history in the hierarchy tree. A neural network model to give predictions about the assignments was added for biologists to start with.